The debugger console provides an interactive command line in the
Debug workspace. Open it with
Cmd+K on macOS, Alt+K on Linux/Windows, or select Console in the workspace.
Opening the first inspector pauses emulation (RUN resumes execution).
Switching inspectors preserves command text, output, history, and the current
run/pause state. Closing one leaves the remaining inspectors open; closing the
last restores the previous execution state. Explicit Run/Pause choices apply
to the shared session. The title bar’s Play switch hides the inspectors
without closing them or changing the current run/pause state; their command
text and history are still there when you return.
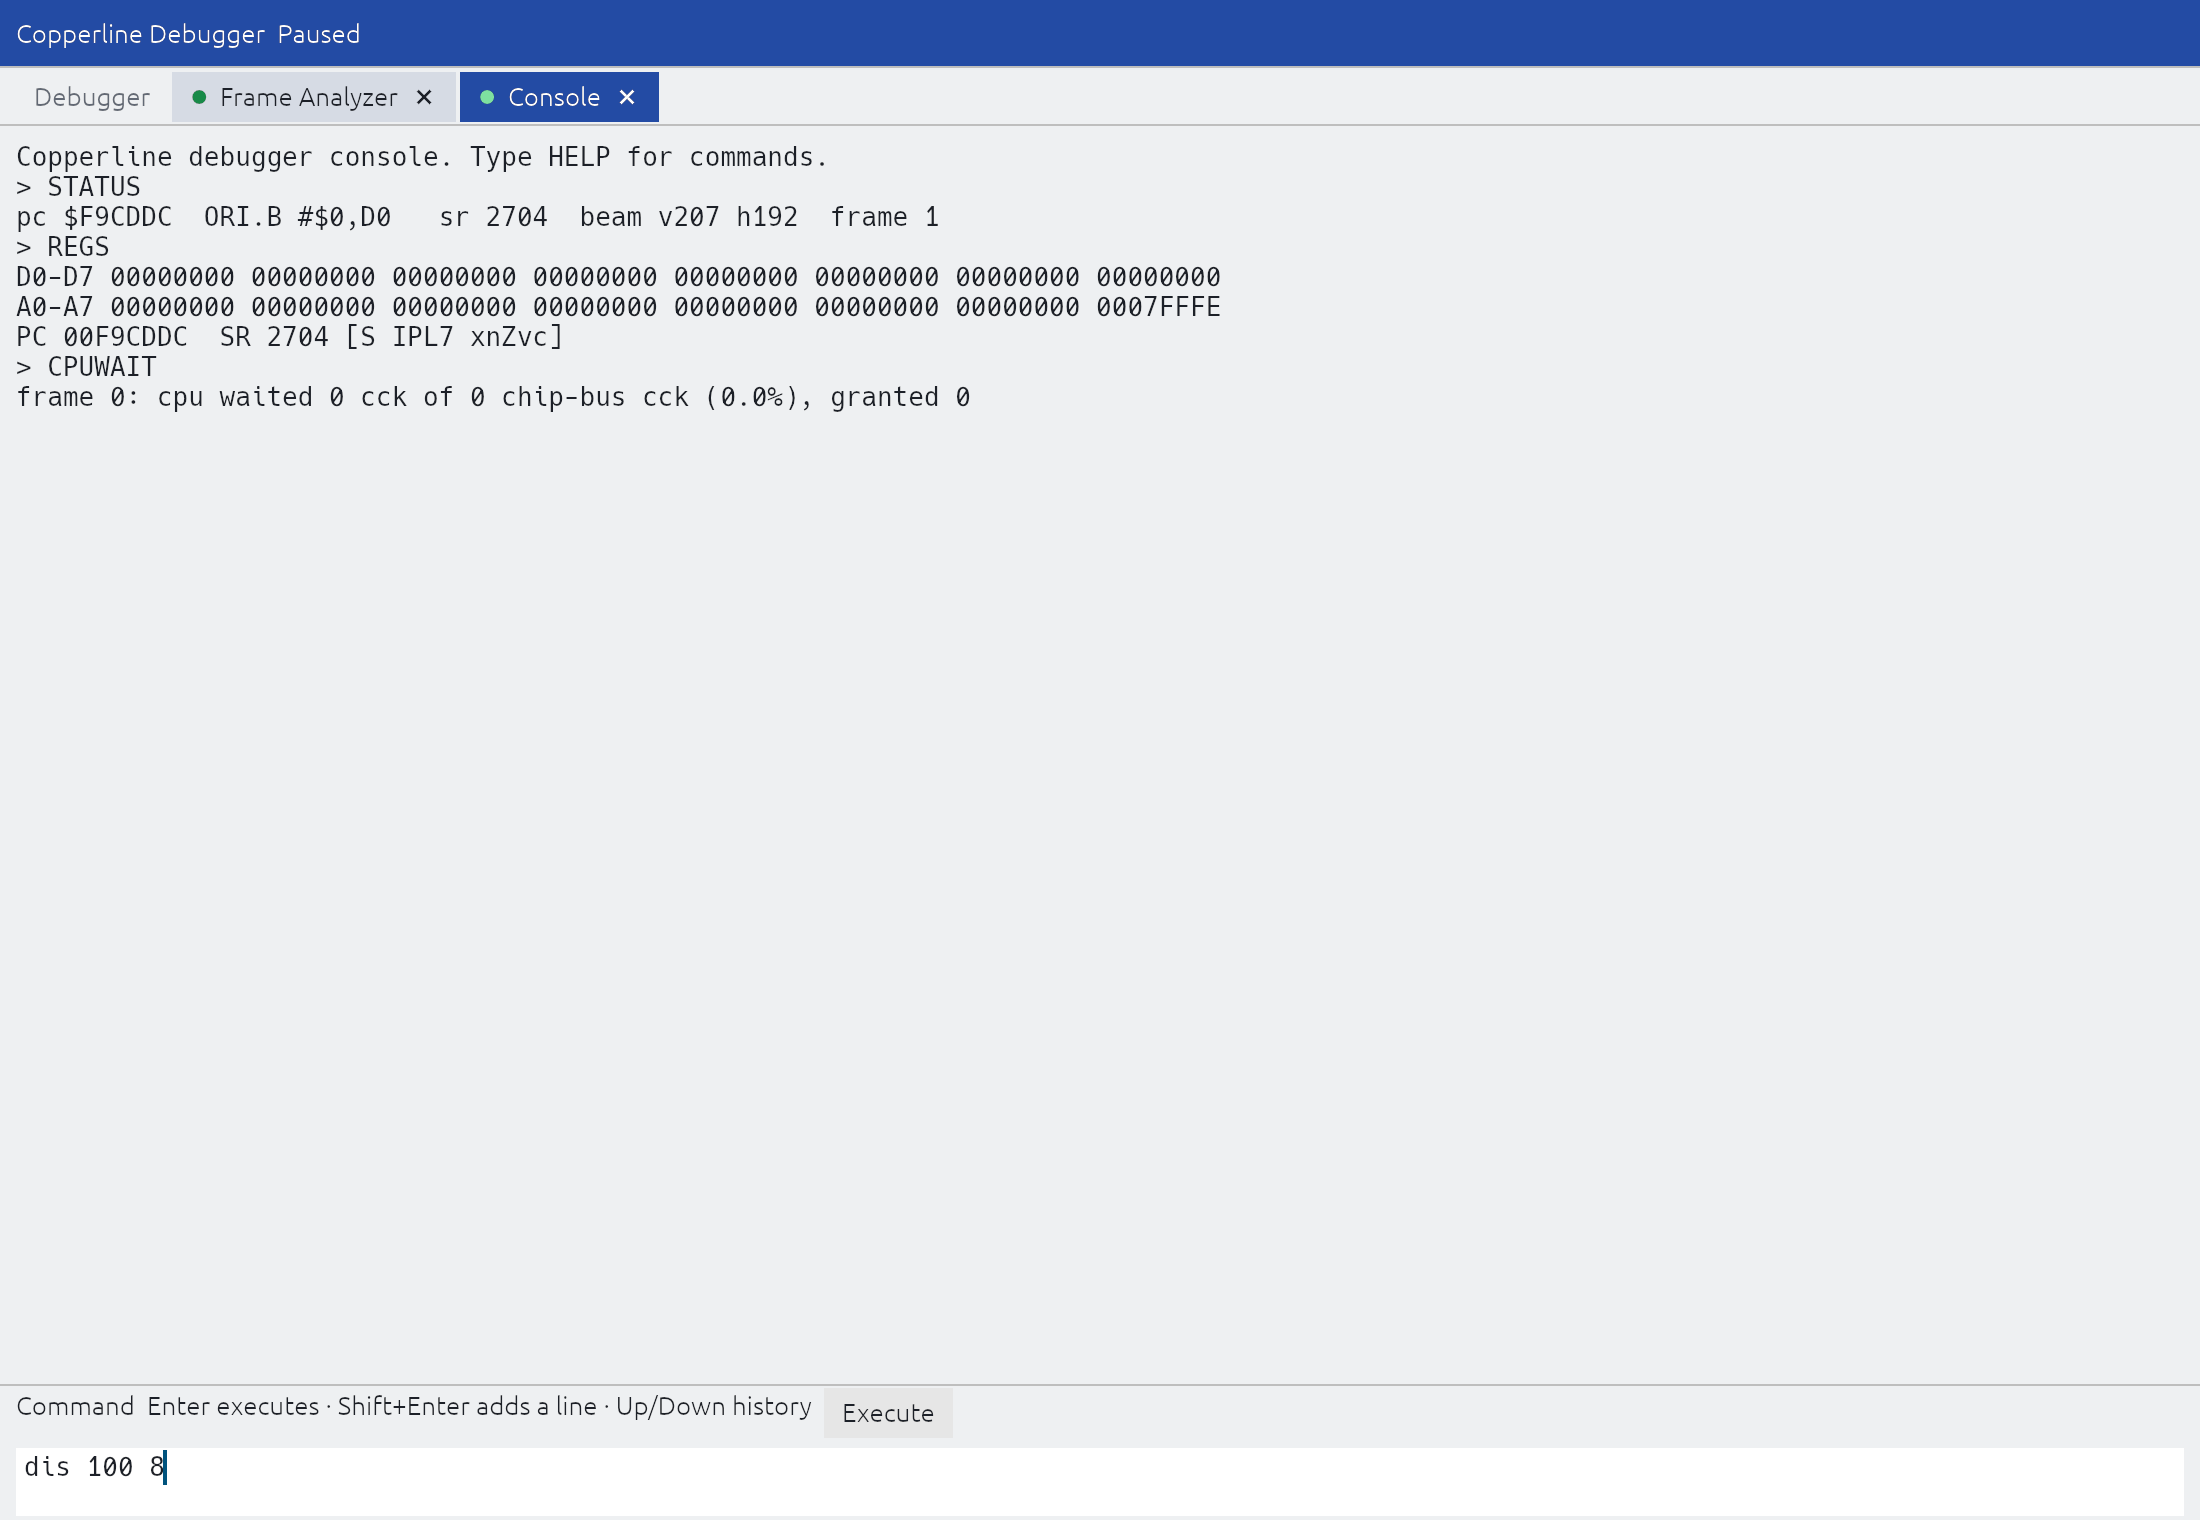
Inspector-only preview of the Console.
Guest debug output sent via the
uaelib trap KPrintF helper or the
memory-mapped printf ports appears in the
console as DBG: lines and is mirrored to the host terminal. New lines refresh
the console while paused too, including after
single steps and breakpoints. The most recent 500 guest debug lines are retained
while the console is closed and shown when it opens. Older lines are discarded;
CLEAR also clears this retained guest log.
Input navigation:
Enteror Execute: run the entered commands, one per line, in order. ACLOSEcommand ends the submitted batch.Shift+Enter: add a line to the command field.Up/Down: browse command history while the command field has focus.PageUp/PageDown, scrollbars, or mouse wheel: scroll the output buffer.Cmd+V(macOS) orCtrl+V(Linux/Windows): paste clipboard contents. Pasted commands remain editable until submitted.Esc: leave the command field; outside a text field, return to Play and keep the inspectors open.
Commands are case-insensitive. Addresses and data values are hexadecimal
(optional $ or 0x prefix); raster beam coordinates (VPOS, HPOS) and the
counts noted below are decimal.
Command reference
Execution control
| Command | Description |
|---|---|
RUN (or GO, CONTINUE, C) | Resume execution |
PAUSE | Pause execution and print the PC, SR, beam position, and frame |
STEP [N] (or S) | Single-step N CPU instructions (decimal, default 1) |
OVER (or NEXT, N) | Step over a BSR, JSR, or TRAP call |
OUT (or FINISH) | Run until the current subroutine returns (RTS/RTE/RTR) |
FRAME (or F) | Advance execution by one video frame |
LINE | Run to the start of the next scanline |
CSTEP | Advance execution by one Copper instruction |
RUNTO ADDR | Run until the PC reaches ADDR |
OUTROM | Run until the PC leaves the Kickstart ROM window ($F80000-$FFFFFF) |
TOSLOT V [H] | Run until the beam reaches raster position (VPOS, HPOS) |
RSTEP [N] (or RS) | Step back N CPU instructions (decimal, default 1) |
RFRAME | Step back one video frame |
RRUN (or RC) | Run backward to the previous breakpoint or watchpoint hit |
STEP, OVER, OUT and RUNTO carry a CPU parked in STOP to the
interrupt that wakes it -- a stopped 68000 retires nothing until one
arrives -- so a single STEP there retires the handler’s first
instruction. A CPU no interrupt can reach (SR mask 7, or nothing enabled
in INTENA) stays stopped after two video frames of waiting.
Breakpoints and watchpoints
| Command | Description |
|---|---|
BREAK ADDR [COND] [IGN N] (or B) | Toggle a PC breakpoint, with an optional condition and ignore count in the Break tab’s syntax |
WATCH ADDR [CLASS] [PC=ADDR] (or W) | Toggle a watchpoint on the word at ADDR. CLASS limits it to one writer: CPU, BLITTER, DISK, COPPER, or a DMA channel (BPL1..BPL8, SPR0..SPR7, AUD0..AUD3). PC=ADDR limits it to CPU writes made by the instruction at that address |
RWATCH NAME|OFFSET (or RW) | Toggle a custom register write watch (e.g. RWATCH DMACON or RWATCH 96) |
MWATCH ADDR[:LEN] [READ|WRITE|ACCESS] (or MW) | Toggle an MMIO (CPU access) watch over LEN bytes (hex, default 2) at ADDR: stops after any CPU data access to the range in the class (default ACCESS), reporting size, value, direction, PC, frame, beam position, and colour clock. Works on device registers such as Akiko’s (MWATCH B80000:40), which a value-comparing WATCH cannot see; see MMIO watches |
BTRAP V [H] | Toggle a raster beam trap at decimal coordinates (VPOS, HPOS) |
CBREAK ADDR | Toggle a Copper breakpoint at a Copper-list address |
CATCH IRQ N | TRAP N | VEC N | Toggle an exception catch: interrupt level 1-7, TRAP #0-#15, or vector 2-255 (decimal) |
BREAKS (or INFO) | List all breakpoints, watches, traps, and catches |
CLEARBREAKS | Remove all breakpoints, watches, traps, and catches |
Memory and state inspection
| Command | Description |
|---|---|
STATUS | Print the PC (with its instruction), SR, beam position, and frame count |
REGS (or R) | Display the 68000 register file (D0-D7, A0-A7, SR, PC) |
MEM ADDR [BYTES] (or M) | Hex/ASCII memory dump; BYTES is hex (default 40, 64 bytes; at most 400) |
DIS [ADDR] [N] (or D) | Disassemble N instructions (decimal, default 8, at most 32) from ADDR (default: PC) |
COPPER [PC|ADDR] [N] | Disassemble the Copper list around the Copper PC (the default) or from ADDR, N instructions (decimal, default 16, at most 64) |
CUSTOM [REG] | Display the chipset summary, or one register (by name or offset) with its access/chipset documentation and decoded fields |
BLITS | List all blits referenced by the traced frame, including stable ID, cross-frame beam span, direction/fill/line mode, channels, pointers/modulos, shifts/masks/minterm, and clocks used versus stalled (requires Frame Analyzer) |
CPUWAIT | Summarize the traced frame’s CPU chip-bus waits: waited clocks by denier (bitplane, Copper, blitter with BLTPRI clear or set, ...) and by access kind, and the instructions that waited longest (requires Frame Analyzer; see the CPU wait view) |
FIND HEXBYTES [START] | Search CPU-visible memory (RAM and ROM) for a byte sequence, from START (default 0) and wrapping round |
WRITER ADDR | Replay retained snapshots to the last observed change of the word at ADDR; moves execution back to that point |
CDTRACE [N] | List the CD drive’s last N commands (default 16), oldest first: emulated issue time, decoded kind, sector range, speed, reply status, and each later step as milliseconds after issue, with the outcome (CD32 Akiko; see the CD tab) |
DBGRES | List debug resources (bitmaps, palettes, copper lists) registered by guest code via the uaelib trap (distinct from RESOURCES, which lists Exec OS resource nodes) |
HISTORY [N] (or H) | Disassemble the last N retired instructions (decimal, default 16, at most 64), recorded while the debugger or console is open |
STACK (or BT) | Heuristic stack trace of recent return addresses |
POKE ADDR VAL | Write a word to memory (ADDR rounded down to even) |
POKE ADDR VAL VAL ... | Write a byte sequence from ADDR: hex byte pairs, as FIND takes them (POKE 60000 12 34 56) |
POKE.B | POKE.W | POKE.L ADDR VAL [VAL ...] | Write one or more bytes, words, or longs consecutively from ADDR (.W/.L round it down to even). A value wider than the size is refused, not truncated |
SETREG REG VAL | Set a CPU register (D0-D7, A0-A7, SP, SR, or PC), e.g. SETREG D0 1234 |
TRACE START [PATH] | Log the disassembly of every executed instruction to PATH (default: a copperline-trace-*.txt file in the traces folder), up to 1,000,000 lines |
TRACE STOP | Stop instruction trace logging |
TRACE | Report the running trace’s file and line count |
WAVE START [ARGS] (or WAVEFORM) | Arm a VCD logic analyser capture (see Waveform export (VCD logic analyzer)) |
WAVE STOP | Stop VCD capture |
WAVE | Report the VCD capture’s state |
HELP (or ?) | Display command summary |
CLEAR | Clear the console output |
CLOSE (or QUIT, EXIT) | Close the console |
Every POKE form is a plain CPU-visible RAM write with the semantics of the
control protocol’s mem.write and the Memory tab’s editor: ROM, overlay
ROM, and device windows are refused and reported, and memory watchpoints
are rebaselined so the poke itself does not stop the machine.
WRITER compares the word after each CPU step. It misses writes that leave
the value unchanged, and its reported PC is the CPU instruction around the
change, which alone does not establish whether the CPU or DMA wrote it.
Use a source-filtered WATCH when that distinction matters. RWATCH watches
custom-register writes; it is not a reverse memory query.
Memory delta search (Trainer / Value hunter)
| Command | Description |
|---|---|
HUNT START [B|W] | Snapshot writable RAM and begin a byte or word search (default: word) |
HUNT EQ|NE|LT|GT VAL | Keep the candidates whose current value compares with VAL (hex) |
HUNT SAME / HUNT DIFF | Keep the candidates whose value is unchanged / changed since the last filter |
HUNT LIST [N] | Display the surviving candidates (decimal N, default 16, at most 64) |
HUNT | Report the search’s width and candidate count |
HUNT OFF | Reset memory search state |
AmigaOS and Exec introspection
| Command | Description |
|---|---|
TASKS | List active, ready, and waiting Exec tasks |
TASK [ADDR|NAME] | Inspect detailed Task or Process structure |
EXECBASE (or EXEC) | Display ExecBase scheduler counters and Disable()/Forbid() nesting |
MEMLIST (or AVAIL) | Display free memory headers and memory fragmentation |
LIBS (or LIBRARIES) | List active library bases and versions |
DEVS (or DEVICES) | List active device drivers |
RESOURCES, PORTS | List Exec resources and public message ports |
SEGMENTS | Display the loaded hunk segments of the current process, with a matching GDB add-symbol-file line |
WHO ADDR | Resolve an address through live library/device LVO targets and ROM resident modules (for example, [exec] AllocMem+$12) |
CATCHTASK [NAME] | Break when Exec schedules a task whose name contains NAME; without NAME, clear the catch |
CATCHALERT | Toggle a breakpoint on exec.library/Alert() (Guru Meditation); at the stop, D7 holds the alert code |
GURU [CODE] | Decode a Guru alert number (default: the value in D7) |