Press Cmd+B on macOS or Alt+B on Linux/Windows (or choose Debugger...
from the menu) to switch the main window to the Debug layout. Opening the
first inspector pauses emulation; Run resumes it.
The Amiga display sits beside the debugger, Frame Analyzer, and Console. Drag the divider to give either side more space. The display keeps its scaling, CRT effects, and RTG support. Select an inspector from the tab strip; each keeps its state while another is shown. Opening another inspector leaves the current run/pause state alone. Inspection reads do not acknowledge hardware registers or consume emulated bus cycles. Stepping, register edits, and memory writes change the machine as requested.
The Play / Debug switch in the title bar changes which layout the window shows. Play restores the previous window size and hides the inspectors without closing them: their selections, captures, and command history remain available when you return to Debug, and anything they are capturing keeps recording meanwhile. Switching layouts keeps the current run/pause state. Closing the main window exits Copperline.
Click the display to give the Amiga keyboard and mouse input. Cmd+G / Alt+G
returns input to the debugger (pressed again, it gives it back to the Amiga).
While the debugger owns input, typing and clipboard shortcuts operate its
fields and never reach the Amiga. While the Amiga owns input, ordinary keys,
including Esc, go to the guest.
Host shortcuts also work while the debugger owns input. In a text field,
macOS Cmd+A and Cmd+Z retain their Select All and Undo/Redo behaviour.
Inspectors
The GPU-rendered inspector UI is included in every desktop build. Monospace
readouts use Hack with a slashed zero to distinguish 0 from O. The font
is bundled; no system installation is needed.
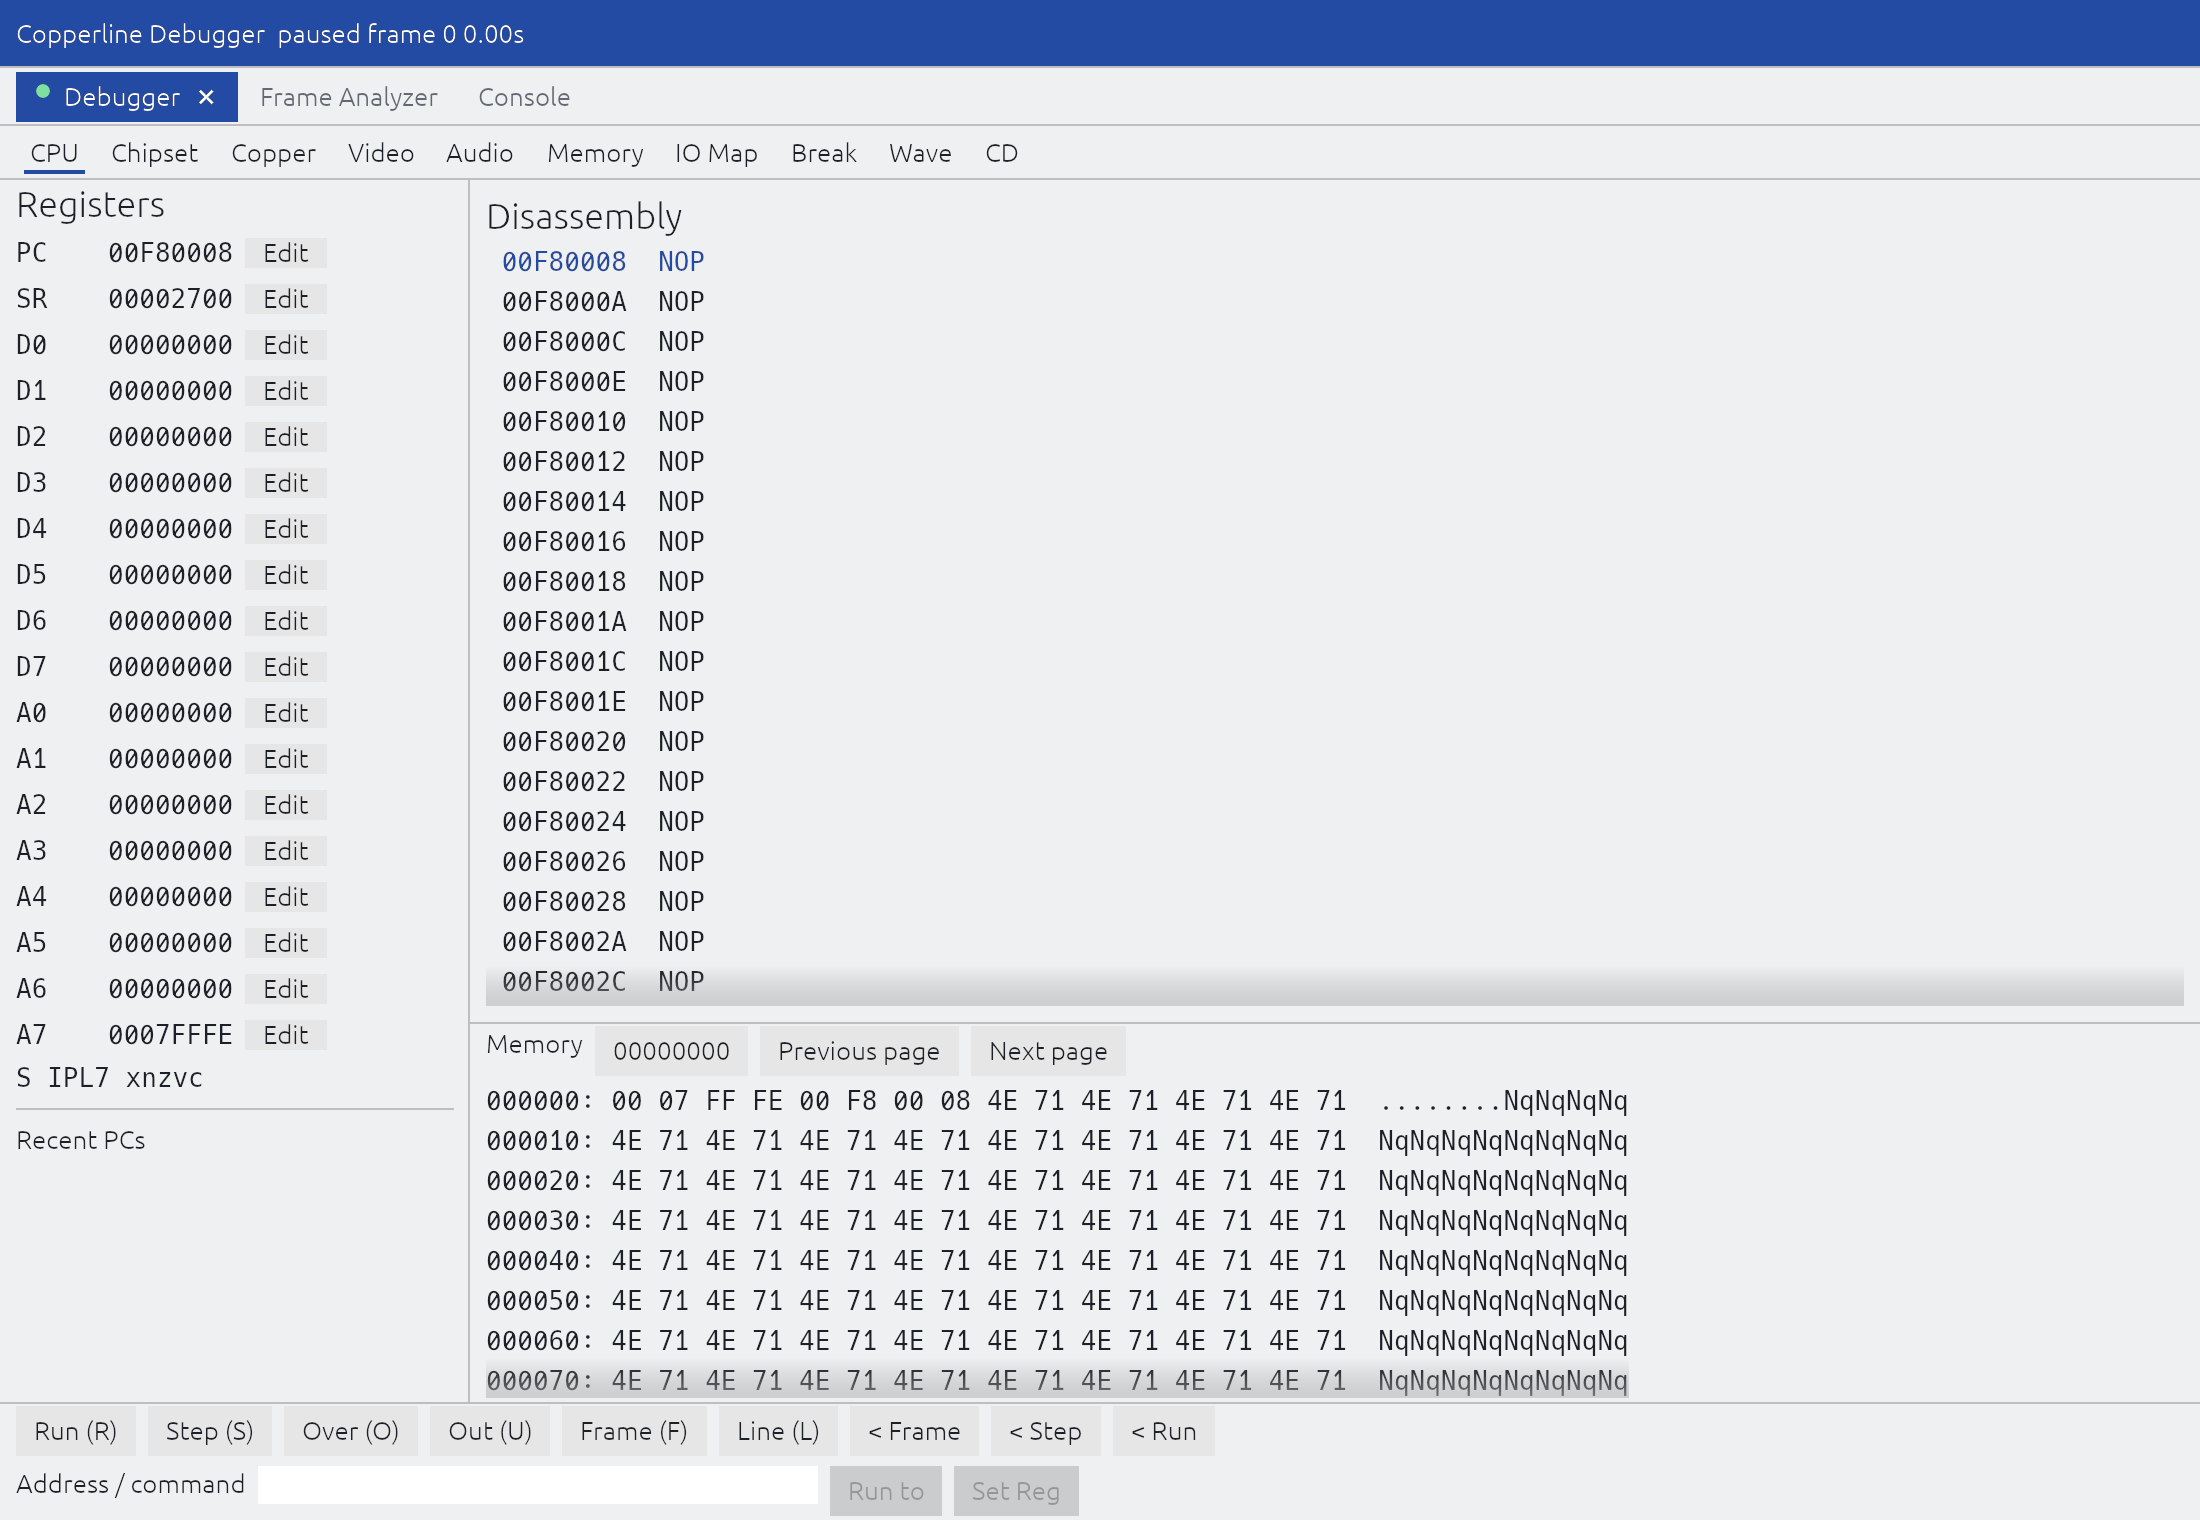
Inspector-only preview of the CPU tab, rendered from the deterministic test machine.
On the CPU tab, drag the dividers to resize the register, disassembly, and memory panes. Text can be selected and copied, and the address/command field supports normal text editing and paste. Register Edit buttons prepare a command in that field; Set Reg applies it. Enter in the field pins the disassembly address (an empty field follows PC), jumps to a memory address, or selects an IO register, according to the active tab. Run to runs until the PC reaches the address in the field.
The CPU memory pane has its own address and page controls. The Memory tab has a Goto address box, Find, Save, Writer, Bits, Poke, and in-place editing of the dump; the other tabs have their own layer toggles, audio mutes, breakpoint and waveform controls. Scrollbars expose content that does not fit the window. The transport keyboard shortcuts work while no text field has focus.
Each inspector’s tab reports what it is doing, so an inspector working in the background can be told from one that was never opened:
| Tab | Meaning |
|---|---|
| Dimmed, no dot | Not open. Click it to open that inspector. |
| Filled, with a dot and a close box | Open. Its state and its capture are there whether or not it is the inspector on screen. |
| Blue | Open and on screen. |
The dot is filled while the inspector’s capture is armed on the running machine, and hollow while the inspector is merely open, showing what it last collected without collecting more. An inspector goes hollow when something else takes its capture away: for example, a profile capture over the control protocol that adopted the pane’s arming disarms it when the capture finishes.
The close box on a tab closes that inspector, as does the controller’s second
button for the one in front. Closing an inspector releases what it was
capturing. While other inspectors remain open they stay available in the
shared workspace and the run/pause state does not change. Closing the last one
restores the execution state from before the first was opened (an explicit
Run/Pause choice made meanwhile takes precedence) and returns to Play. Esc
leaves a text field first. Outside a text field it returns to Play, keeping
the inspectors open.
Select Frame Analyzer above the debugger tabs to inspect its Beam, Blits, Memory, and Resources views. Capture frame records a frame, and Run collects live frames. Switching between the debugger and analyzer preserves their selections, capture data, and current run/pause state. The analyzer stays armed while its view is hidden. Closing it releases captures it owns; captures started through the control protocol continue independently.
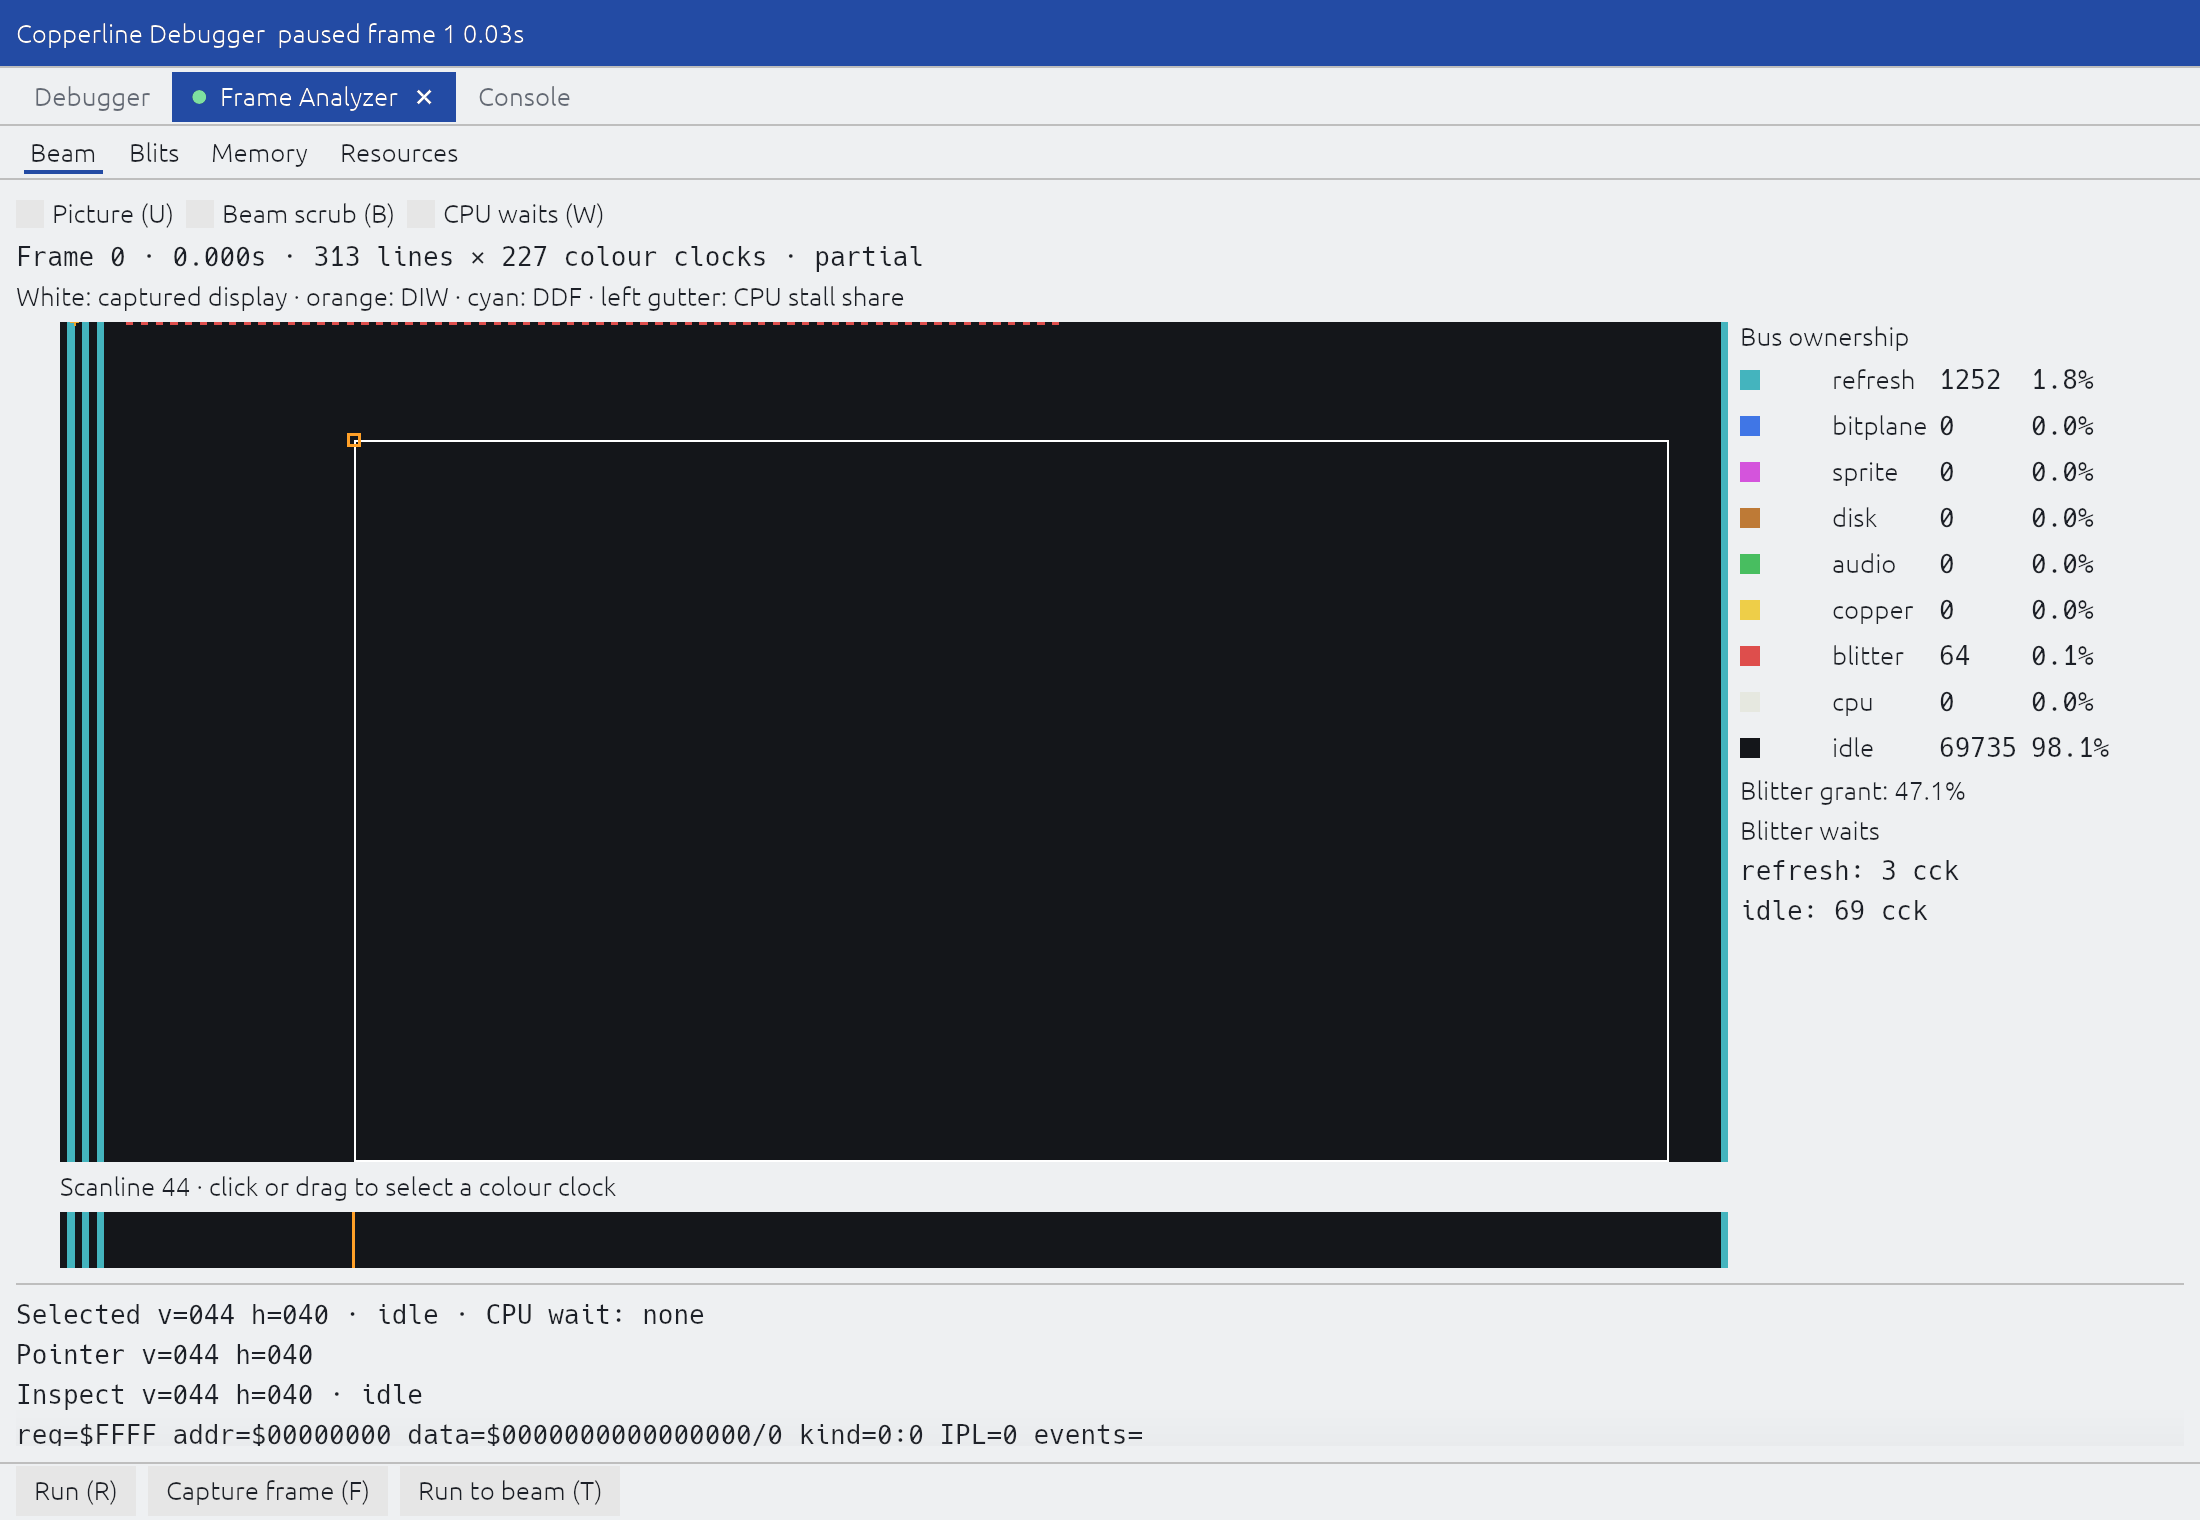
Inspector-only preview of the Beam view, rendered from the analyzer test machine.
Click or drag the beam raster or scanline strip to select a slot. The Picture, Beam scrub, CPU waits, and Run to beam controls show their single-key shortcuts on their labels. The Memory view offers address presets and cell picking; Blits shows source/result previews with previous/next selection; Resources offers paging, previews, and Save resource.... Text readouts can be selected and copied.
Click a PC in Most stalled PCs to open the CPU disassembly there. Below the selected beam slot, Inspect memory opens the Memory tab, and a Copper instruction link pins the Copper listing at that instruction. The heat map’s pinned cell also links to memory. Follow Copper returns the listing to the live Copper. These links inspect the current machine at the recorded address; they do not restore historical memory or run the guest, and the analyzer’s capture and selection remain available.
Select Console at the top, or use Cmd+K / Alt+K, for the same
command interpreter and history in this window. Output is selectable;
the command field supports editing and clipboard paste. Enter or Execute
runs the entered commands. Shift+Enter adds a line, and pasted commands remain
editable until submitted. Up/Down browse history. Console output continues to
arrive while another inspector is selected.
The Debug window size, display divider, CPU pane sizes, and selected debugger
and analyzer tabs are saved when returning to Play, closing an inspector, or
exiting Copperline, and restored on reopening or relaunching. Debug keeps the
expanded window on its monitor. Returning to Play restores the previous window
position when that monitor is available; switching layouts preserves
fullscreen. The preferences live in inspector-layout.toml in the
host data directory. They hold layout choices
only, not command text, captures, or machine state. Opening a specific
inspector always selects the one requested.
Live inspector snapshots and layout updates are limited to 20 Hz; input and stepping update immediately. The Amiga display keeps its normal presentation cadence while the inspectors reuse their last layout between updates.
Tabs
CPU
Displays the 68000 register file (D0-D7, A0-A7), the status register (SR,
with decoded flags), the program counter (PC), the last eight retired PCs, and a
live disassembly starting at the current instruction. Lines that carry a
breakpoint are marked *. To inspect code elsewhere, type a hexadecimal address
in the address/command field and press Enter; Follow PC, or Enter on an empty
field, returns the listing to the PC.
Chipset
Summarizes the chipset state: beam position and frame counter, DMACON, INTENA
and INTREQ with decoded flags, the Copper pointers (COP1LC, COP2LC, COPPC),
the display registers (BPLCON0-BPLCON2, FMODE, DIWSTRT, DIWSTOP,
DDFSTRT, DDFSTOP, and the bitplane modulos), the bitplane and sprite pointers,
and COLOR00-COLOR31.
Copper
Copper list inspector and disassembler. Shows COP1LC, COP2LC, the Copper PC,
and its state (running, waiting with the beam position it waits for, or stopped).
The listing follows the live Copper; addresses with a Copper breakpoint are
marked *.
CBreak +/-: Toggles a Copper breakpoint at the hex address in the address/command field.
CStep (
C): Steps forward by one Copper instruction (advances throughWAITinstructions to the subsequent instruction).Follow Copper: Returns a listing pinned from the Frame Analyzer to the live Copper.
Video
Shows how BPLCON0 configures the display (plane count, resolution, HAM or dual
playfield) and whether bitplane and sprite DMA are enabled, with layer isolation
toggles:
Toggle individual bitplanes (1-8) or sprites (0-7) to isolate visual elements without altering collision detection or emulation state.
Decodes sprite registers (
SPRxPOS,SPRxCTL), armed status, and DMA line counts, with a thumbnail of each sprite’s fetched data.Displays the full 32-colour (OCS/ECS) or 256-colour (AGA) palette.
Audio
Decodes Paula audio channels (0-3) and expansion sound devices (CD-DA, MT-32, Coppersynth, Toccata, MHI). Displays each channel’s DMA state machine status, period, volume, active buffer pointers, and a live waveform scope. Each source has its own Mute box. Each source also has a fixed-height row with its scope beside its details, so pending DMA and interrupt flags cannot move other channels. Long detail lines scroll horizontally inside their row.
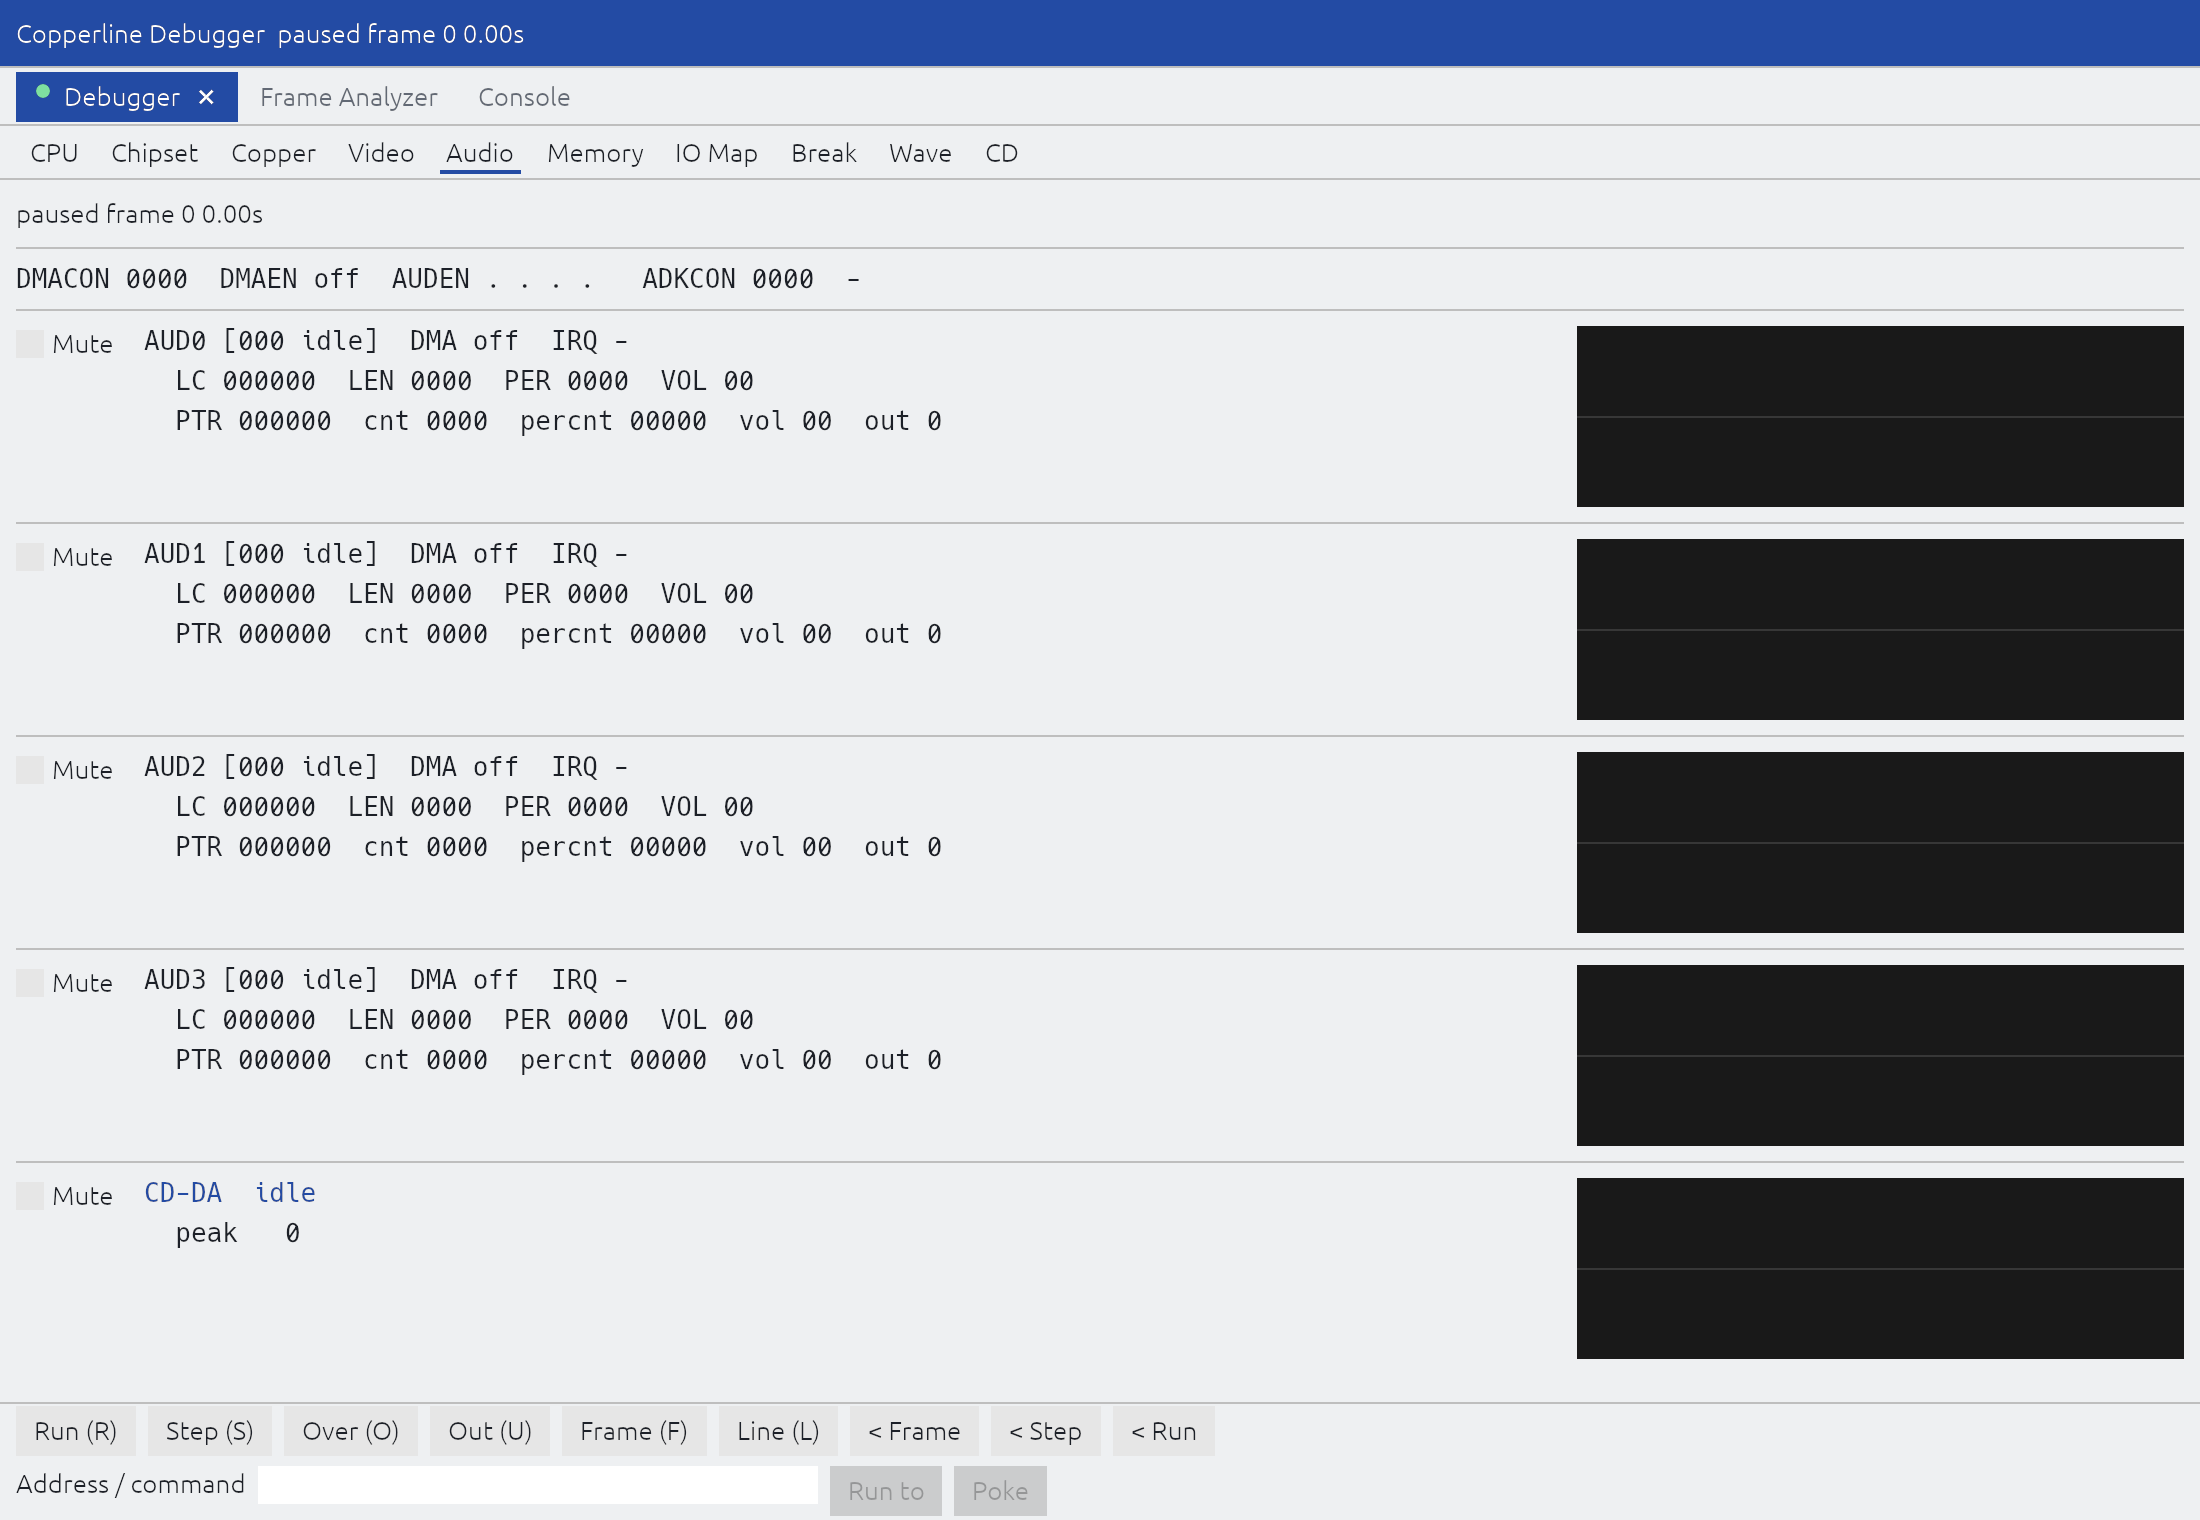
Audio scopes remain aligned as channel status changes.
Memory
Hexadecimal and ASCII memory dump viewer (256 bytes per page).
Goto: The page’s base address. Drag the value, or click it and type a hex address. The address/command field also jumps: type an address there and press Enter. Previous page / Next page,
PageUp/PageDown, and the cursor keys (one row) move through memory.Find: Searches CPU-visible memory for the hex bytes typed in the address/command field (
C0 FFEEandC0FFEEare the same pattern). Pressing it again continues past the last match.Save...: Saves the range typed as
ADDR LEN(both hex, at most 16 MiB) to a file.Writer?: Replays the reverse-execution snapshot ring to find the instruction that last wrote the word at the typed address.
Bits: Switches the dump to a 1-bit-per-pixel bitplane view (the button then reads Hex and switches back). A decimal number from 1 to 512 in the field sets the row stride in bytes; the default of 40 is one 320-pixel lores row.
Poke: Writes the word in the address/command field (
ADDR VALUE).
Editing memory in place
Click a byte in the hex column to select it, then type hex digits: the first digit replaces the high nibble, the second completes the byte and moves the selection to the next one. In the ASCII column a typed printable character replaces the byte. Edited bytes are shown in blue until they are written. While a byte is selected:
Arrow keys move the selection; at the edge of the page the view scrolls to follow it.
PageUp/PageDownpage the view with the selection.Backspaceforgets a half-typed digit, or steps back one byte.Enterwrites every edited byte. So does leaving the dump: clicking a button, another tab, or the address box, or focusing any text field.Escdiscards the edits and clears the selection (it does not leave Debug while a byte is selected).
Typed characters never reach the transport shortcuts, so C, F, R,
and S are hex digits or text while editing. The outcome (bytes written,
or the address that refused) appears beside the tab’s controls. Bytes in
ROM, the overlay ROM, and device windows are drawn grey and cannot be
selected; the message names the address.
Edits are plain CPU-visible RAM writes with the semantics of the console’s
POKE and the control protocol’s mem.write: the data changes, no bus
cycles are charged, no interrupt or DMA state moves, and the Break tab’s
memory watchpoints are rebaselined so the edit itself does not stop the
machine. As with mem.write, a write is not part of the reverse-execution
journal, so replaying backwards across it can diverge.
IO Map
Interactive map of the custom chipset registers ($DFF000-$DFF1FE) with
their current values. Selecting a register decodes its individual bitfields
(e.g. DMACON, INTENA, BPLCON0, ADKCON) and shows its access direction,
chipset availability, and a summary from the checked-in
custom-register Markdown catalogue.
The console, control protocol, DAP Chipset scope, and VS Code Custom Registers
tree consume the same generated table.
Move the selection with the cursor keys (left and right move a column),
PageUp / PageDown, or Previous register / Next register, or type
an offset (96) or address (DFF096) in the address/command field and press
Enter.
Break
Manages PC breakpoints, memory watchpoints, custom register write traps, MMIO (CPU access) watches, exception catchpoints, and beam traps, and lists the Copper breakpoints set on the Copper tab. The reason for the last stop is shown at the top.
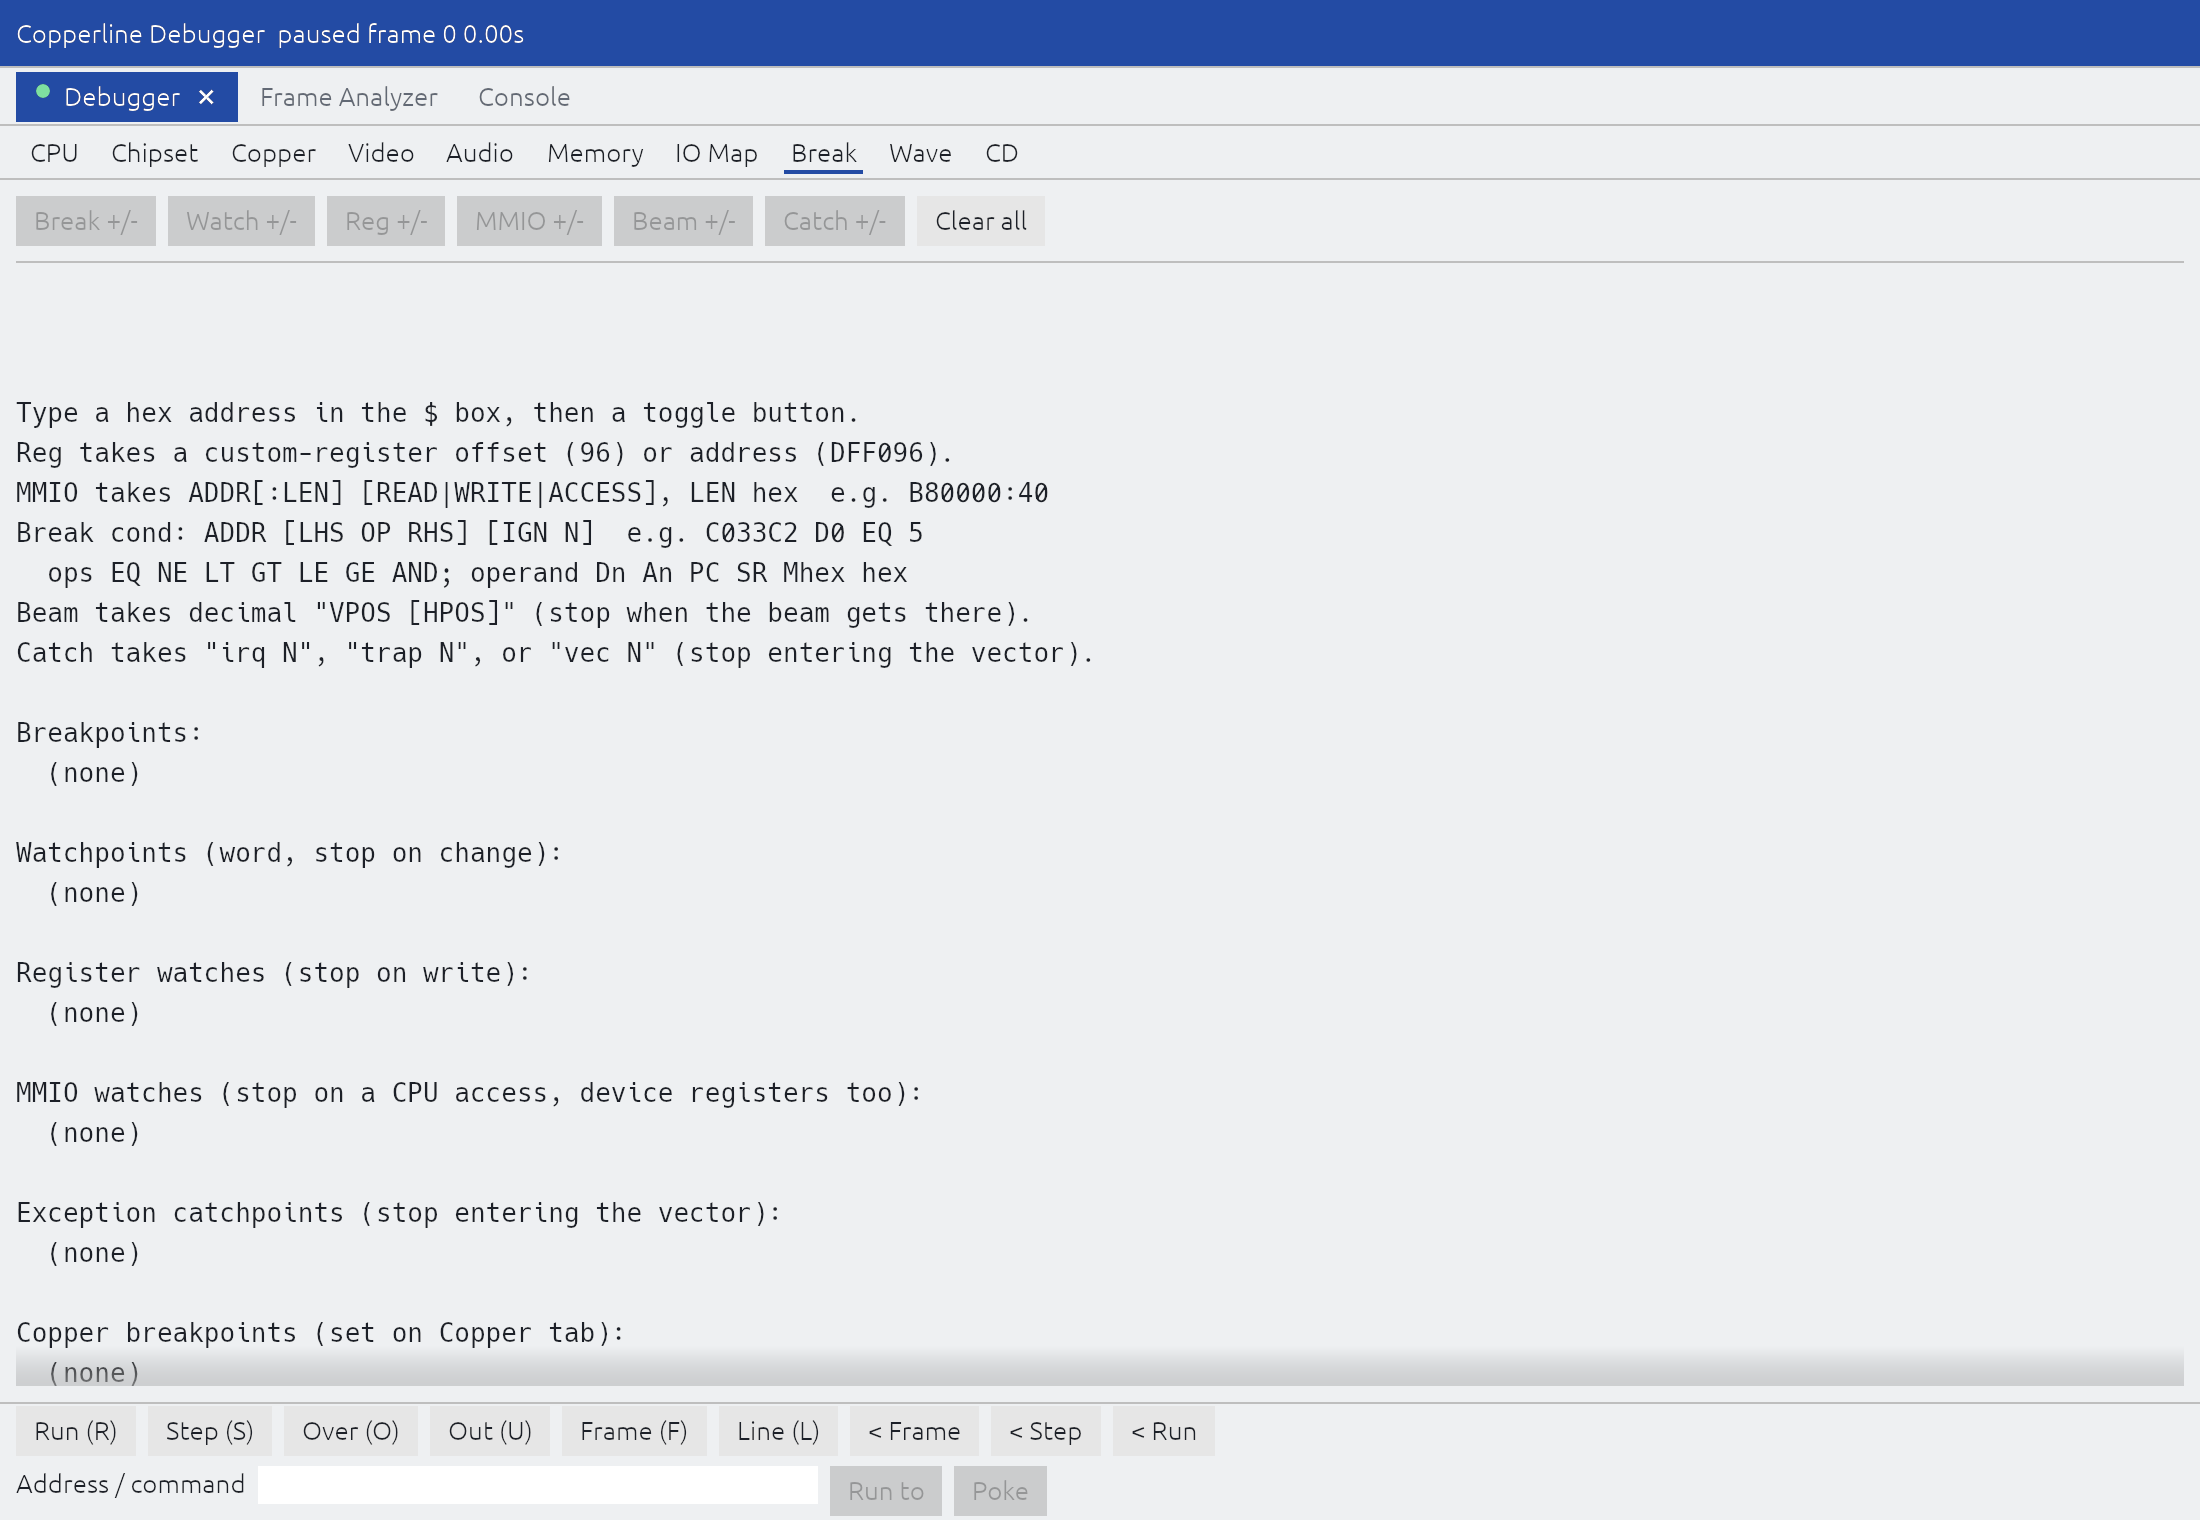
Active PC breakpoints, memory watchpoints, custom register traps, and MMIO watches.
Wave
Arms a VCD waveform capture from the options typed in the address/command field (Arm) and ends it early (Stop), and shows the capture’s progress. See Waveform export (VCD logic analyzer).
CD
The CD drive’s command trace (CD32 Akiko only; other machines show why the tab is
empty). Each command the host sent is listed newest first as a headline -- its
number, decoded kind (read, play, toc, stop, pause, info, led, ...),
sector range, requested speed, the drive’s reply status byte, and the emulated time
it was issued -- followed by its timeline: each later step as milliseconds after
issue (accept when the drive parsed the packet, exec when it acted on it, reply
when the answer reached the host, first when a read, play, or TOC dump delivered
its first unit), the units delivered, and how it ended (end, stopped,
superseded, refused, no_disc, abandoned after a state load, ...).
Commands still running are highlighted.
All times are emulated, so the trace is identical from run to run and unaffected by
warp. Comparing two ROMs’ drivers, a locate’s first-sector latency, or the gaps
between reads is a matter of reading the offsets. The console’s CDTRACE and the
control protocol’s cd.trace / event.cd read the same trace.
Breakpoints, watchpoints, and traps
Type the target in the address/command field, then press the matching button on the Break tab. Each button is a toggle (Break +/-, Watch +/-, ...): it adds the entry, or removes it if it already exists. Clear all removes every breakpoint, watch, trap, and catch.
Break: PC breakpoint. Execution halts before the instruction executes.
Watch: Memory watchpoint on a word. Halts when the word changes, whoever wrote it: the CPU, the Copper, the blitter, or disk DMA. The console’s
WATCHcan restrict it to one writer.Reg: Custom register write trap, given as an offset (
96) or an address (DFF096); the console’sRWATCHalso accepts register names. Halts whenever the CPU or the Copper writes to the register.MMIO: CPU access watch over a byte range,
ADDR[:LEN] [READ|WRITE|ACCESS](LENin bytes, hex like every entry-box number, default 2; default classACCESS), e.g.B80000:40for Akiko’s 64 register bytes. Halts after the instruction whose data access touches the range, and the stop reports the access’s address, size, value, direction, PC, frame, beam position, and colour clock. A memory watch compares values and cannot see device registers (reading one has side effects, so it cannot be peeked); the MMIO watch is taken at the CPU’s bus access itself, so it sees Akiko, the CIAs, Gayle, Zorro boards, and custom registers as well as RAM.Beam: Raster beam trap. Halts when the beam reaches the specified decimal
VPOS(and optionalHPOS).Catch: Exception vector trap (e.g.
irq 3,trap 0,vec 2).
Conditional and counted breakpoints
A Break entry, like the console’s BREAK, accepts a condition and an
ignore count after the address:
ADDR [LHS OP RHS] [IGN N]Operands: Registers (
D0-D7,A0-A7,PC,SR), memory words (M<hex>, e.g.MC00002), or hex constants. A register name wins over a hex constant, so write the value$D0as0D0.Operators:
EQ,NE,LT,GT,LE,GE,AND(bitwise test).Ignore count (
IGN N): Skips the firstNqualifying hits (Nis hex).
Examples:
C033C2 D0 EQ 5: Breaks at$C033C2only whenD0equals 5.40 MC00002 AND 4000 IGN A: Breaks at$40when bit$4000of word$C00002is set, after skipping 10 occurrences.
Transport controls
| Button | Key | Action |
|---|---|---|
| Run / Pause | R | Resume or pause emulation |
| Step | S | Single-step one instruction |
| Over | O | Step over a subroutine call (BSR/JSR/TRAP) |
| Out | U | Run until the current subroutine returns |
| Frame | F | Advance emulation by one video frame |
| Line | L | Advance emulation to the start of the next scanline |
| CStep (Copper tab) | C | Step one Copper instruction |
| Run to | -- | Run until the PC reaches the address in the address/command field |
< Frame | -- | Step backward one video frame |
< Step | -- | Step backward one instruction (see Reverse debugging) |
< Run | -- | Run backward to the preceding breakpoint or watch hit |
The keys work on every debugger tab while no text field has focus. The reverse buttons are available once the reverse-execution history is armed, which opening the debugger does (see Reverse debugging).
A CPU parked in STOP (an idle Workbench waiting for a disk, a program
waiting for its interrupt) executes nothing until an interrupt arrives, so
Step, Over, Out and Run to carry it to the interrupt that
wakes it. A single Step there runs the machine on to that interrupt and
retires one instruction -- the first of its handler, where control actually
goes -- so the PC lands inside the handler instead of standing still. The
CPU tab shows CPU stopped while it is parked. When no interrupt can reach
the CPU -- the SR mask is 7, or nothing is enabled in INTENA -- a step
gives up after two video frames, leaves the machine stopped where the
hardware itself is stuck, and says so on the display.
Frame Analyzer
Select Frame Analyzer in the Debug workspace to inspect chip-bus slot allocations and memory access patterns.
Frame Analyzer: chip-bus ownership and per-slot inspection.
While no text field has focus, F captures a frame, R runs or pauses, and
M switches between the Beam and Memory tabs. Each tab’s own keys are listed
below.
Beam tab
Displays a 2D heatmap indexed by raster beam coordinates (X = colour clock HPOS,
Y = scanline VPOS). Each cell indicates which subsystem owned the chip bus during
that colour clock (CPU, Copper, blitter, bitplane, sprite, audio, disk, refresh,
or idle). Outlines mark the captured display (white) and the display window
(orange), and vertical lines mark the DDF fetch bounds (cyan).
Click or drag in the raster or the scanline strip below it to select a colour clock, or move the selection with the arrow keys; the selected slot’s full record appears below. It includes the custom register, address, transfer data and width, owner subtype, CPU-visible IPL, and decoded hardware events. An interlaced display alternates a long field and a short field one line shorter, so the raster is laid out against the long field: the diagram keeps its size and the cell under the pointer stays put as the fields alternate. A short field has no last line, and a position over it reads the line before.
Copper MOVE execution slots are cross-shaped markers coloured by destination
register class (blitter, audio, display/bitplane, sprite, palette, or control).
Their readout includes the Copper instruction address; the reciprocal
copper.list {"trace": true} entry links that instruction back to this beam
slot.
Picture (
U): Draws the rendered frame beneath the bus heatmap.Beam scrub (
B): Shows the picture only up to the selected slot -- what the CRT had drawn when the beam was there. Implies the picture underlay.Run to beam (
T): Runs until the beam reaches the selected colour clock.CPU waits (
W): Switches the heatmap, scanline strip, legend and counters column to the CPU’s side of the arbitration. Every colour clock the CPU asked for the chip bus and was denied is painted in the colour of what held it: bitplane, sprite, disk, audio, refresh, Copper, the blitter with BLTPRI clear (the “nice” hold before the slowdown counter yields), a hotter red for the blitter with BLTPRI set (its warm-up fence included, where the slot itself is idle), and grey for the 020+ chip port’s own turnaround. Everything else is dimmed so the stolen cycles read against the DMA pattern that took them. The counters column shows the waited clocks as a share of the CPU’s chip-bus time, the breakdown by denier and by access kind (read, which includes opcode prefetches; fetch, for immediate and extension words read outside the prefetch queue; write; custom register), and the instructions that waited longest (Most stalled PCs: per instruction on the precise CPU loop, per batch under[cpu] jit). A ROM PC is shown with its live LVO or resident name, such as[exec] AllocMem+$12, once AmigaOS has initialized the relevant Exec lists. The selected-slot line names the denier whenever the selected slot was a CPU wait, in either view.Stall gutter: the narrow strip left of the heatmap is drawn in both views: one bar per line, as long as the share of that line’s colour clocks the CPU spent waiting, in the colour of the line’s dominant denier -- a profile of where the frame chokes the CPU.
The console’s CPUWAIT command prints the same summary for the traced frame,
and a profile capture exports it per frame.
Profile captures over the control protocol (Per-frame profiling) share bus tracing with the Frame Analyzer: closing the pane does not interrupt an active capture, and stopping a capture keeps an open pane recording.
Blits tab
The Blits tab lists every recorded blit with its start/end frame and beam position, ascending/descending, fill or line mode, enabled channels, transfer geometry, BLTDPT, and colour clocks used versus stalled. A blit that crosses a frame boundary retains one stable identity and is finalized in both frame records.
Selecting a row shows the first active source channel and the computed
result/D channel side by side. These previews use the exact captured DMA words,
including shifts, first/last-word masks, modulos, and latched BLTxDAT inputs;
the detail line shows the simplified minterm expression and whether plane
count came from the registered destination bitmap or BPLCON0. The Up/Down keys,
or Previous blit / Next blit, change the selected blit. The same renderer
is available over the control protocol as blit.render.
Memory heatmap tab
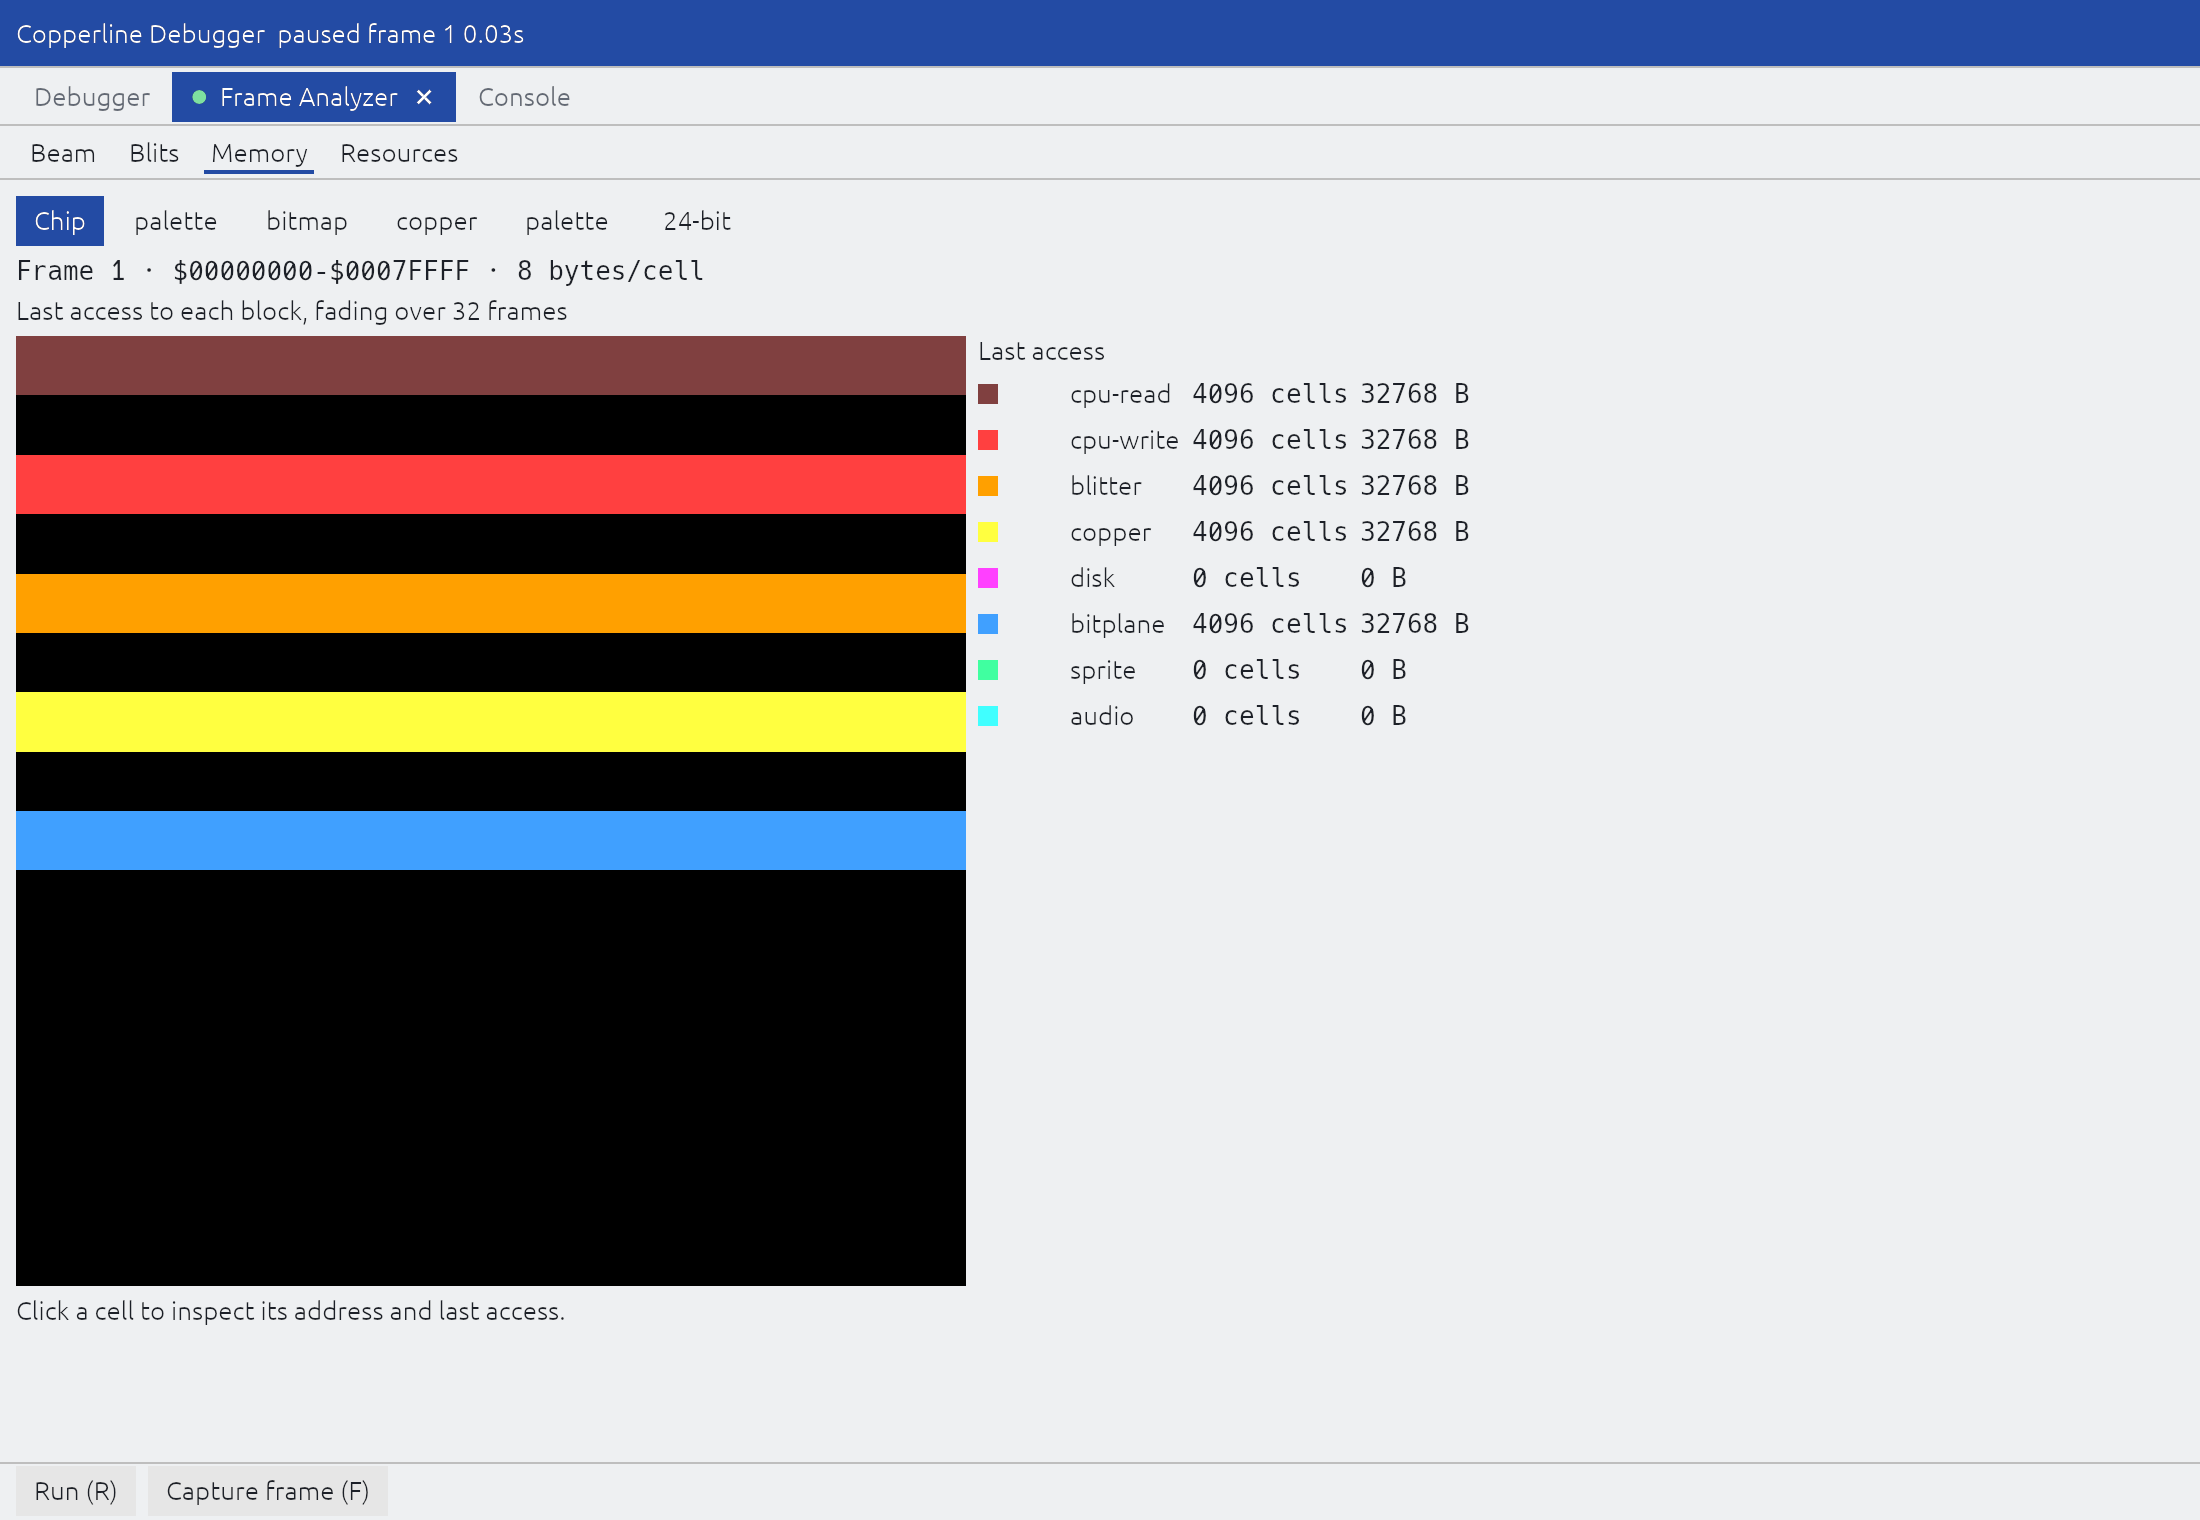
Frame Analyzer Memory tab displaying address space activity.
The Memory tab displays a 256x256 grid over one window of the address space. Each cell is coloured by what last touched its block (CPU read or write, blitter, Copper, disk, bitplane, sprite, or audio DMA), fading over 32 frames; the legend beside it counts the cells and bytes per accessor. The preset buttons above the grid select the window: one per fitted RAM bank (Chip, Slow, MB for motherboard RAM, CPU for accelerator RAM, Z2 / Z3 for RAM boards) and 24-bit for the whole 24-bit address space.
The first four debug resources registered by the guest via the uaelib trap appear as presets too, named by the guest (the Resources tab lists all registered items). Hovering over or pinning a cell displays its address range and the name of any registered resource mapped there. Click a cell, or move the pinned cell with the arrow keys, to see what last touched it and when; Inspect memory then opens that address on the debugger’s Memory tab.
Resources tab
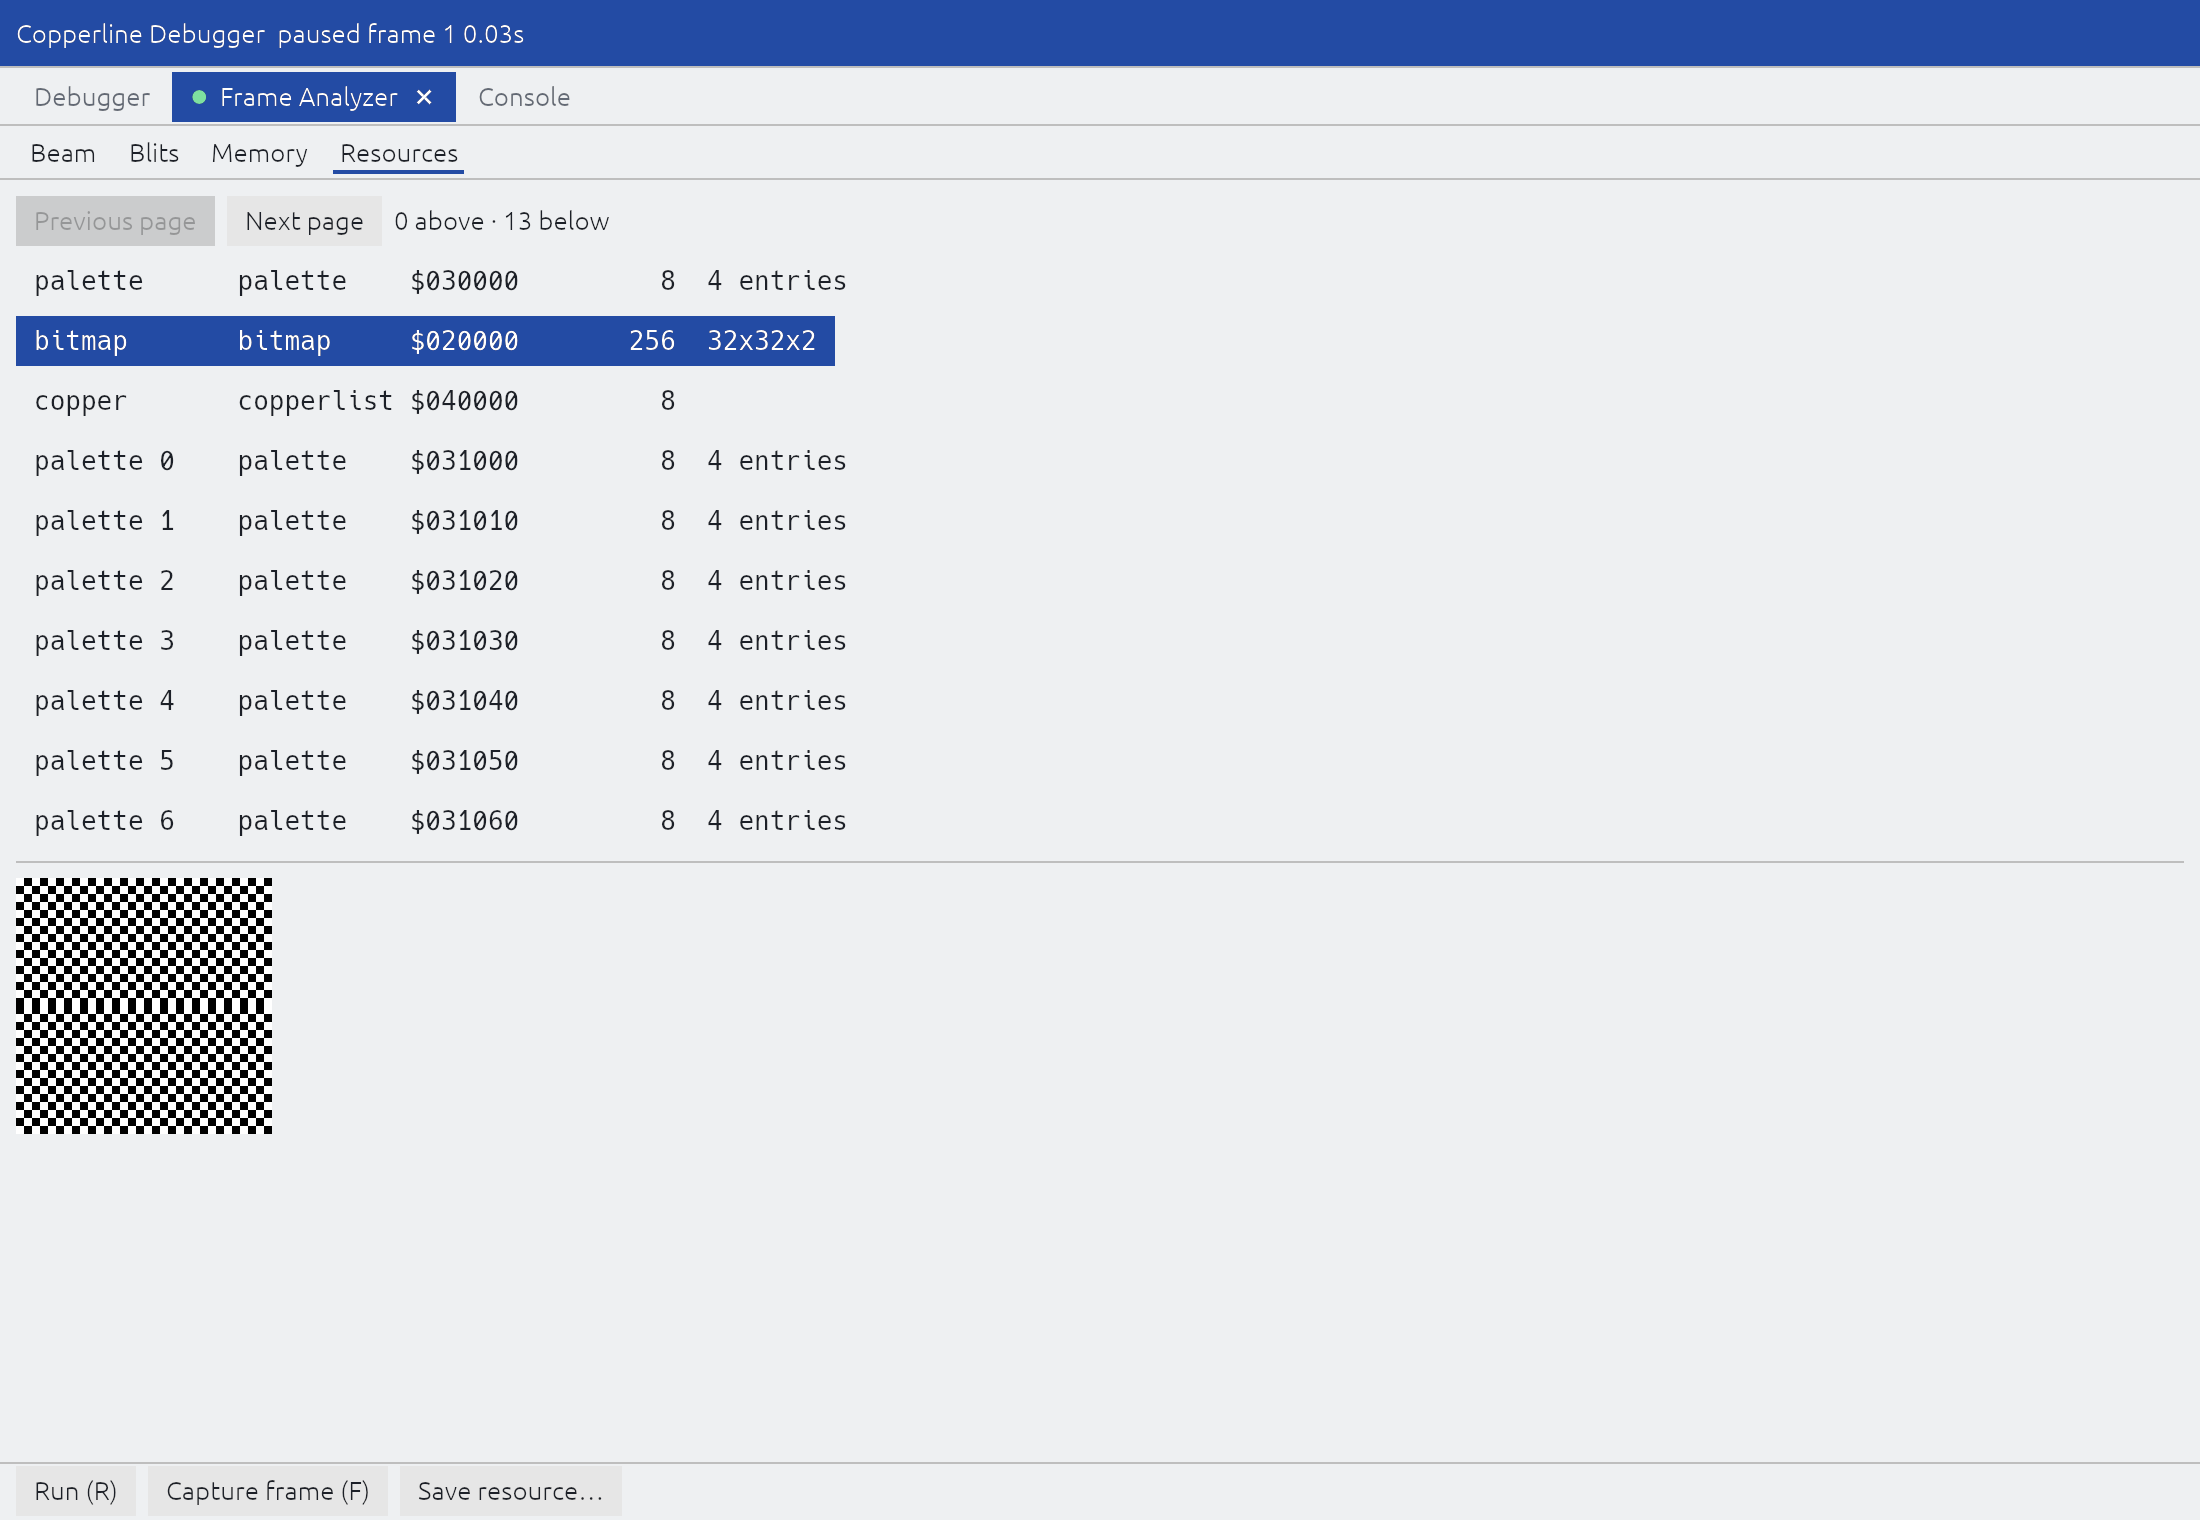
Frame Analyzer Resources tab previewing a registered bitmap.
The Resources tab inspects memory structures registered by guest software via
uaelib trap helpers (debug_register_bitmap, debug_register_palette,
debug_register_copperlist):
Bitmap: Decodes planar or interleaved bitmaps of up to 8 bitplanes using the first registered palette resource (or the live Denise palette if none is registered). A masked bitmap’s mask planes are skipped, and a HAM bitmap is shown as plain indexed pixels; out-of-range geometry is clamped, with a note under the preview.
Palette: Displays the registered 12-bit colour words as a swatch grid.
Copper list: Disassembles the first 12 instructions at the registered address.
The selected entry is decoded from guest memory on every repaint, so the preview
follows the program as it runs. The arrow keys and PageUp / PageDown scroll
a registry longer than the table. Save resource... exports the selected
bitmap or palette as a PNG through the same decoder.
The same registry is available over the control protocol (debug.resources,
debug.resource.export) and through the console’s DBGRES command.