Bartman’s Amiga C/C++ extension supplies a compiler, patched GDB, source annotations, and a visual profiler. Copperline supplies the emulated machine and its instruction, DMA, and memory captures. This walkthrough uses the public Copperline fork of the extension, installed from a locally built VSIX. It remains usable without an upstream release or merge of Bartman PR 307.
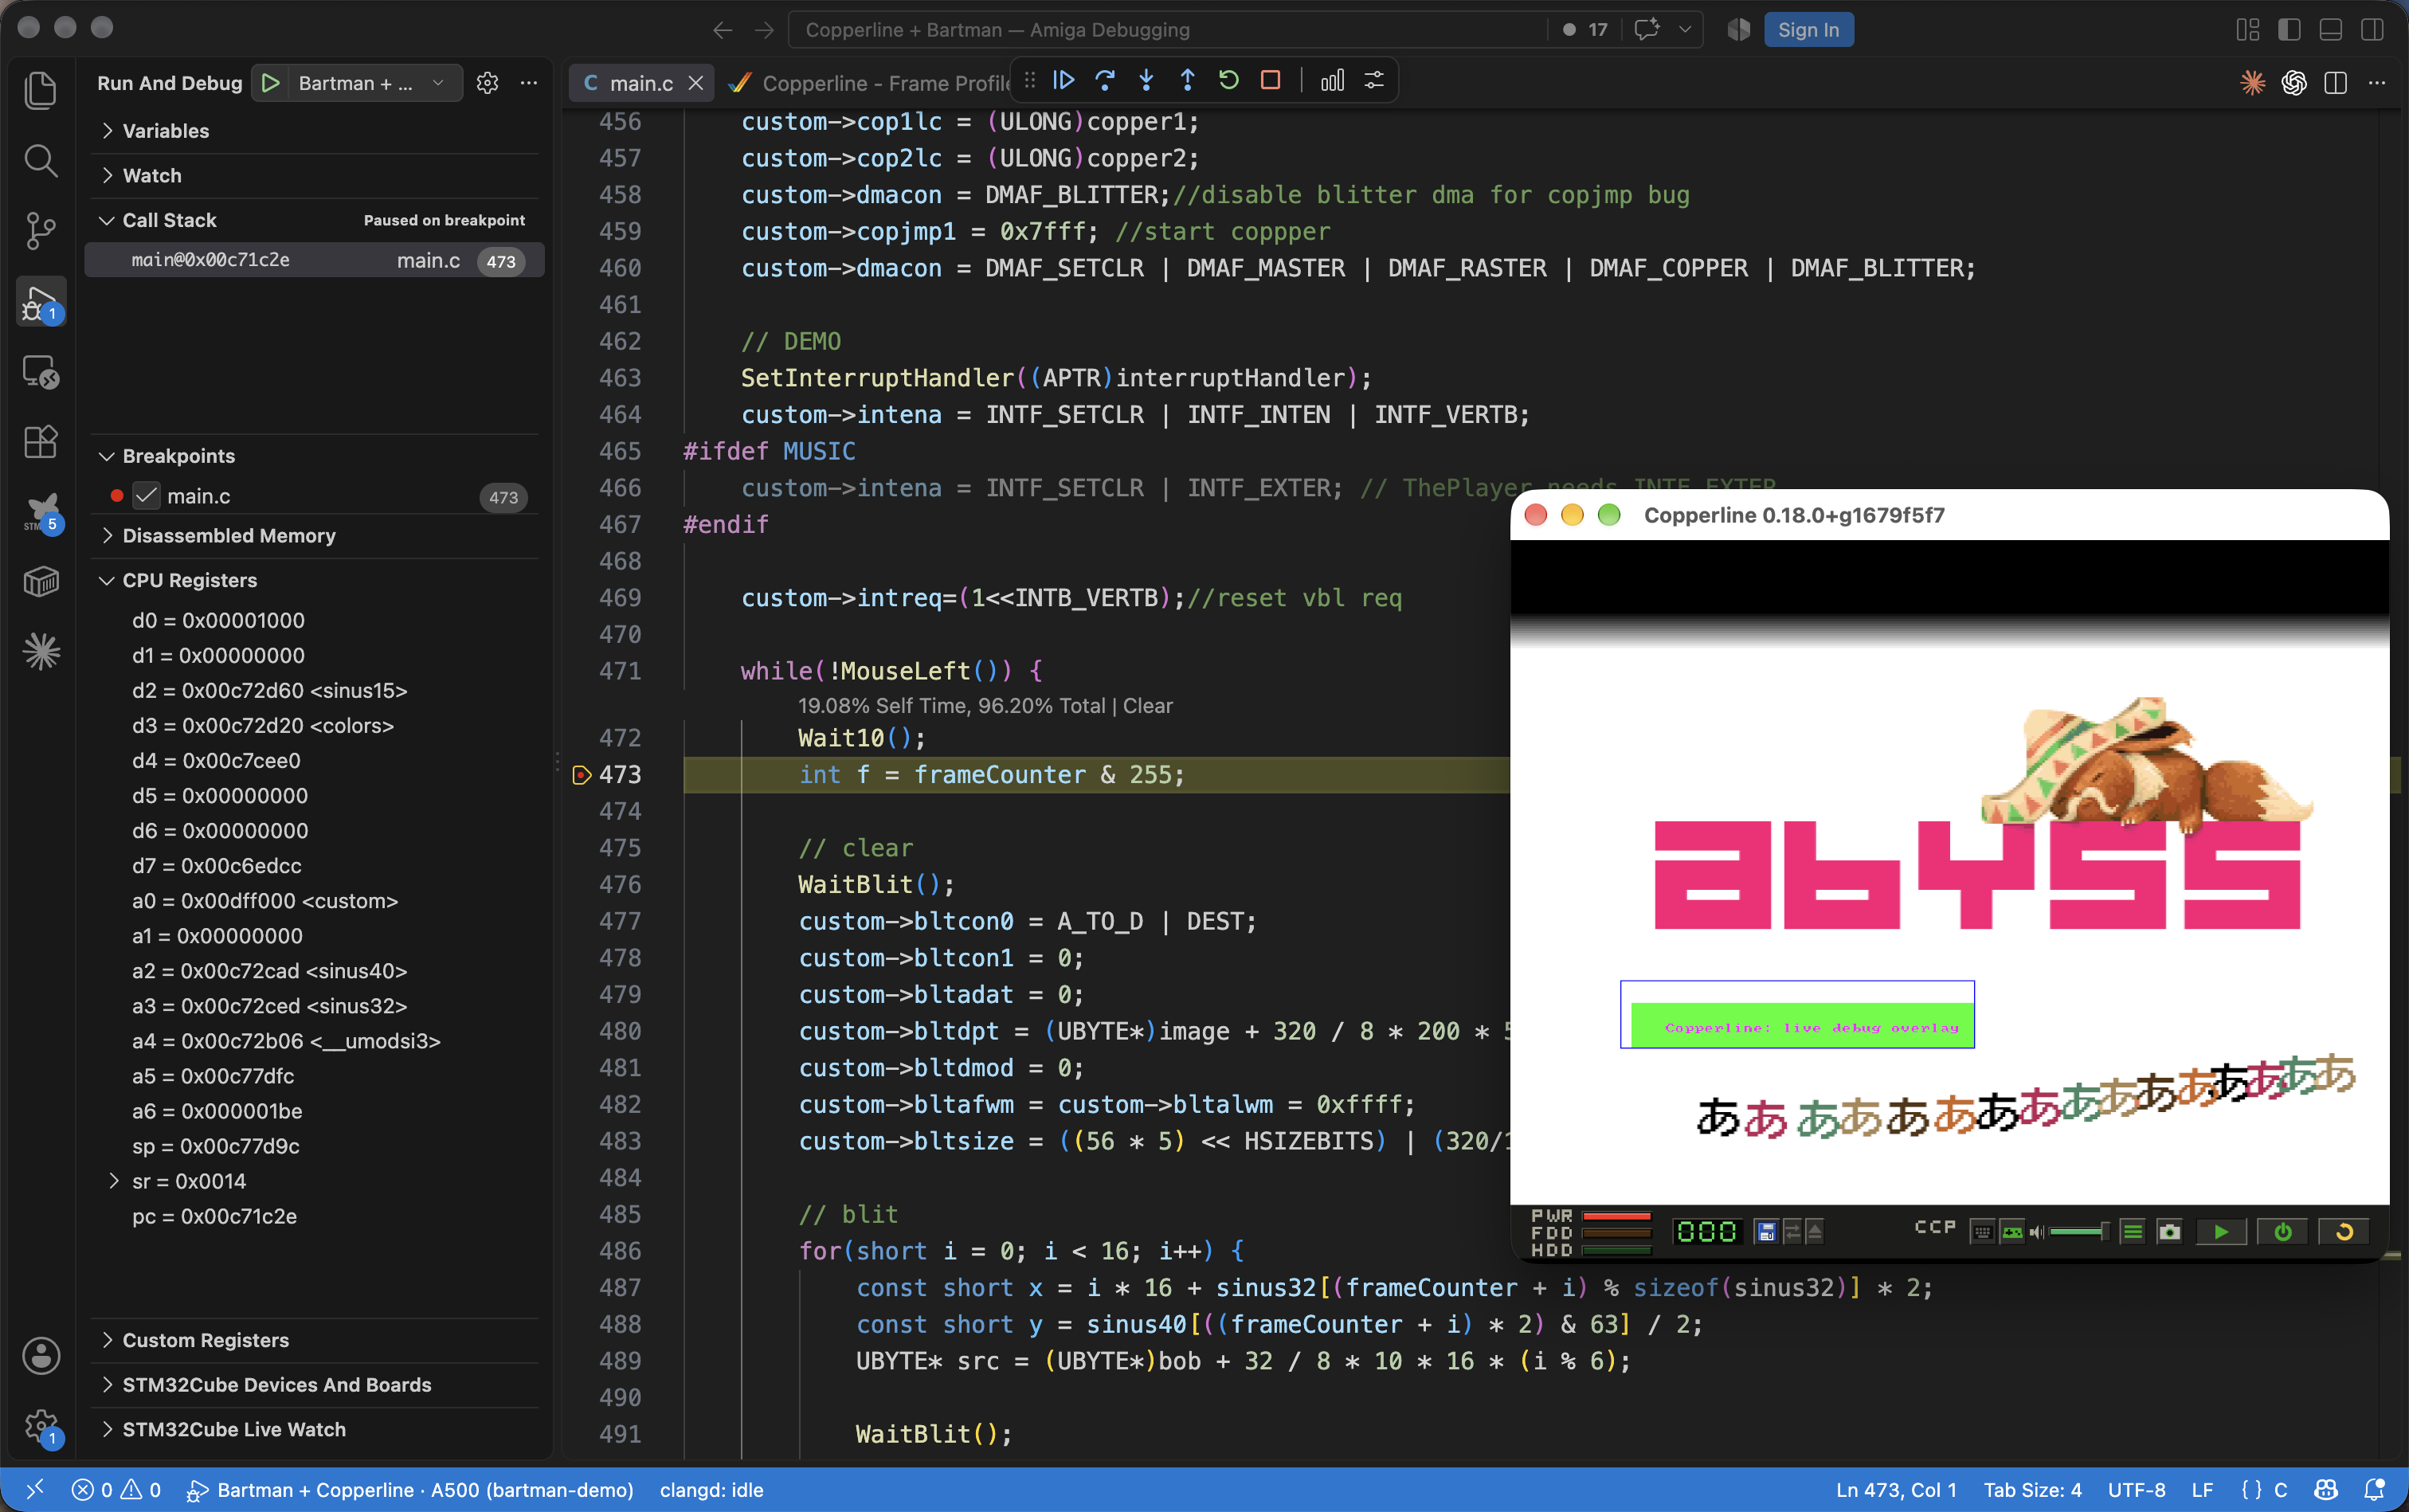
A source breakpoint in the template’s frame loop, with the live Copperline window beside VS Code. The source cost annotations come from a profile capture; they are not populated just by starting the debugger. Open full-resolution screenshot.
Install the fork without waiting for upstream
First build Copperline, including its AROS ROM
assets. Use Copperline 0.19.0 or later, or a source build containing commit
3d334a11; both include the fix that keeps a windowed Bartman launch paused
until GDB connects.
You also need Git, Node.js/npm, and Visual Studio Code. The fork includes
the compiler, GDB, elf2hunk, and SDK files; no separate Amiga SDK download is
needed. Its bundled host tools are x86-64 binaries for macOS, Linux, and
Windows. Apple Silicon Macs need Rosetta to run those tools. The walkthrough
was tested on macOS; the included Linux and Windows binaries target x86-64,
not native ARM hosts. The demo’s build task uses make on macOS/Linux and
the bundled gnumake.exe on Windows.
Clone the public fork and pin the tested revision. These commands deliberately use a commit, so a later change to the branch does not silently change this setup:
git clone --depth 1 --single-branch --branch copperline-backend https://github.com/LinuxJedi/vscode-amiga-debug.git bartman-copperline
cd bartman-copperline
git fetch --depth 1 origin 7d18d370a030da7d365238e0d700f2be303214ce
git checkout --detach 7d18d370a030da7d365238e0d700f2be303214ce
npm ci
npx --yes @vscode/vsce package --no-dependencies --out bartman-copperline.vsix
code --install-extension ./bartman-copperline.vsix --force
Packaging runs the extension’s production build and bundles its host tools,
so the VSIX is large. Keep it if you want to reinstall the same version on
another development machine. If code is unavailable, use Extensions:
Install from VSIX... in VS Code and select bartman-copperline.vsix.
Reload the VS Code window after installing it.
The fork keeps the extension ID BartmanAbyss.amiga-debug. It replaces
the Marketplace copy of that extension; it does not appear as a second
extension. In Extensions, right-click its entry and check that Auto Update
is off. VS Code normally disables automatic updates for VSIX installations;
see its VSIX and update instructions.
Avoid replacing this installation with the standard Marketplace build,
which does not include this Copperline backend.
The pinned revision is
7d18d37
(extension version 1.8.3). The revision identifies this build more precisely
than the version number. To update later, select a new revision from the
fork’s copperline-backend branch,
fetch and check out that commit, and repeat npm ci, packaging, and VSIX
installation. Upstream merging is not part of that update procedure.
Create the graphics demo
Open a new, empty folder in VS Code. Run Amiga: Init Project from the command palette. It copies the extension’s template into the open folder; the command requires that folder to be empty.
To match the screenshots’ workload, comment out
#define MUSICnear the top ofmain.c. The graphics and blitter animation remain active.Put these settings in
.vscode/settings.json, replacing the executable path with your Copperline release build:
{
  "amiga.emulator": "copperline",
  "amiga.copperline-path": "/absolute/path/to/Copperline/target/release/copperline",
  "amiga.program": "out/a"
}
On Windows use a path such as
C:/src/Copperline/target/release/copperline.exe. The setting names the
executable file, not a folder. If VS Code reports amiga.emulator as an
unknown setting, check that the fork VSIX is installed and reload the window.
Replace .vscode/launch.json with this configuration. Keep the template’s
.vscode/tasks.json, which supplies the compile build task and tool paths:
{
  "version": "0.2.0",
  "configurations": [
    {
      "type": "amiga",
      "request": "launch",
      "name": "Bartman + Copperline: A500",
      "program": "${workspaceFolder}/out/a",
      "config": "A500",
      "chipmem": "1m",
      "slowmem": "512k",
      "uaelog": false,
      "emuargs": ["--noaudio"],
      "preLaunchTask": "compile"
    }
  ]
}
Here program is the base name: the build produces both out/a.elf
(GDB symbols and DWARF) and out/a.exe (the Amiga executable). Do not add
either suffix to this Bartman launch field. Keep the files together and
rebuild both after changing code.
Omitting kickstart boots AROS. If adapting an existing UAE launch, remove
any cpuboard option; normal launches support AROS or a ROM you own from
Kickstart 1.3 onward. Keep detached launch disabled on 1.3. The launch above uses PAL A500 timing,
1 MiB chip RAM, and 512 KiB slow RAM, matching the profiler walkthrough.
Run to a source breakpoint
Select Bartman + Copperline: A500 in Run and Debug and press F5.
The build task compiles the template, Copperline opens, and GDB stops in the
loaded program. Set a breakpoint in main.c on int f = frameCounter & 255;
inside the main while (!MouseLeft()) loop, then continue to it. At the
pinned revision this is around line 473; use the statement rather than relying
on a line number.
The demo has now initialized its Copper list and graphics. Expand CPU
Registers, inspect the call stack, and step through source. The stock
template is optimized with -Ofast and LTO, so some locals show
<optimized out>. For the native adapter’s variable and reverse-stepping
workflow, see Stop, inspect, and step back.
Capture and explore a frame
While paused in the frame loop, click Profile on the debug toolbar. It
advances the emulator through a complete frame capture and opens an
.amigaprofile editor. The timeline combines CPU call stacks with DMA and
blitter activity. Profile (Multi) captures 50 frames in this Bartman
extension; start with one frame while learning the views.
Select a time on the timeline to inspect that point in the capture. The screenshots below are views of captured state; continuing the emulator does not turn an already opened profile into a continuously updating monitor. Keep the saved profile with its matching sources and ELF when revisiting a capture later. The profile editor can be opened without a running emulator.
Inspect the displayed bitmap and Copper list
Open Resources, choose *Copper (fr. 1)* from Bitmap, and choose
*Copper* for Palette. This infers a planar bitmap from the recorded
bitplane setup and Copper register writes. Open Copper alongside it
using the profile editor’s split view to compare the picture with its
WAIT and MOVE instructions.
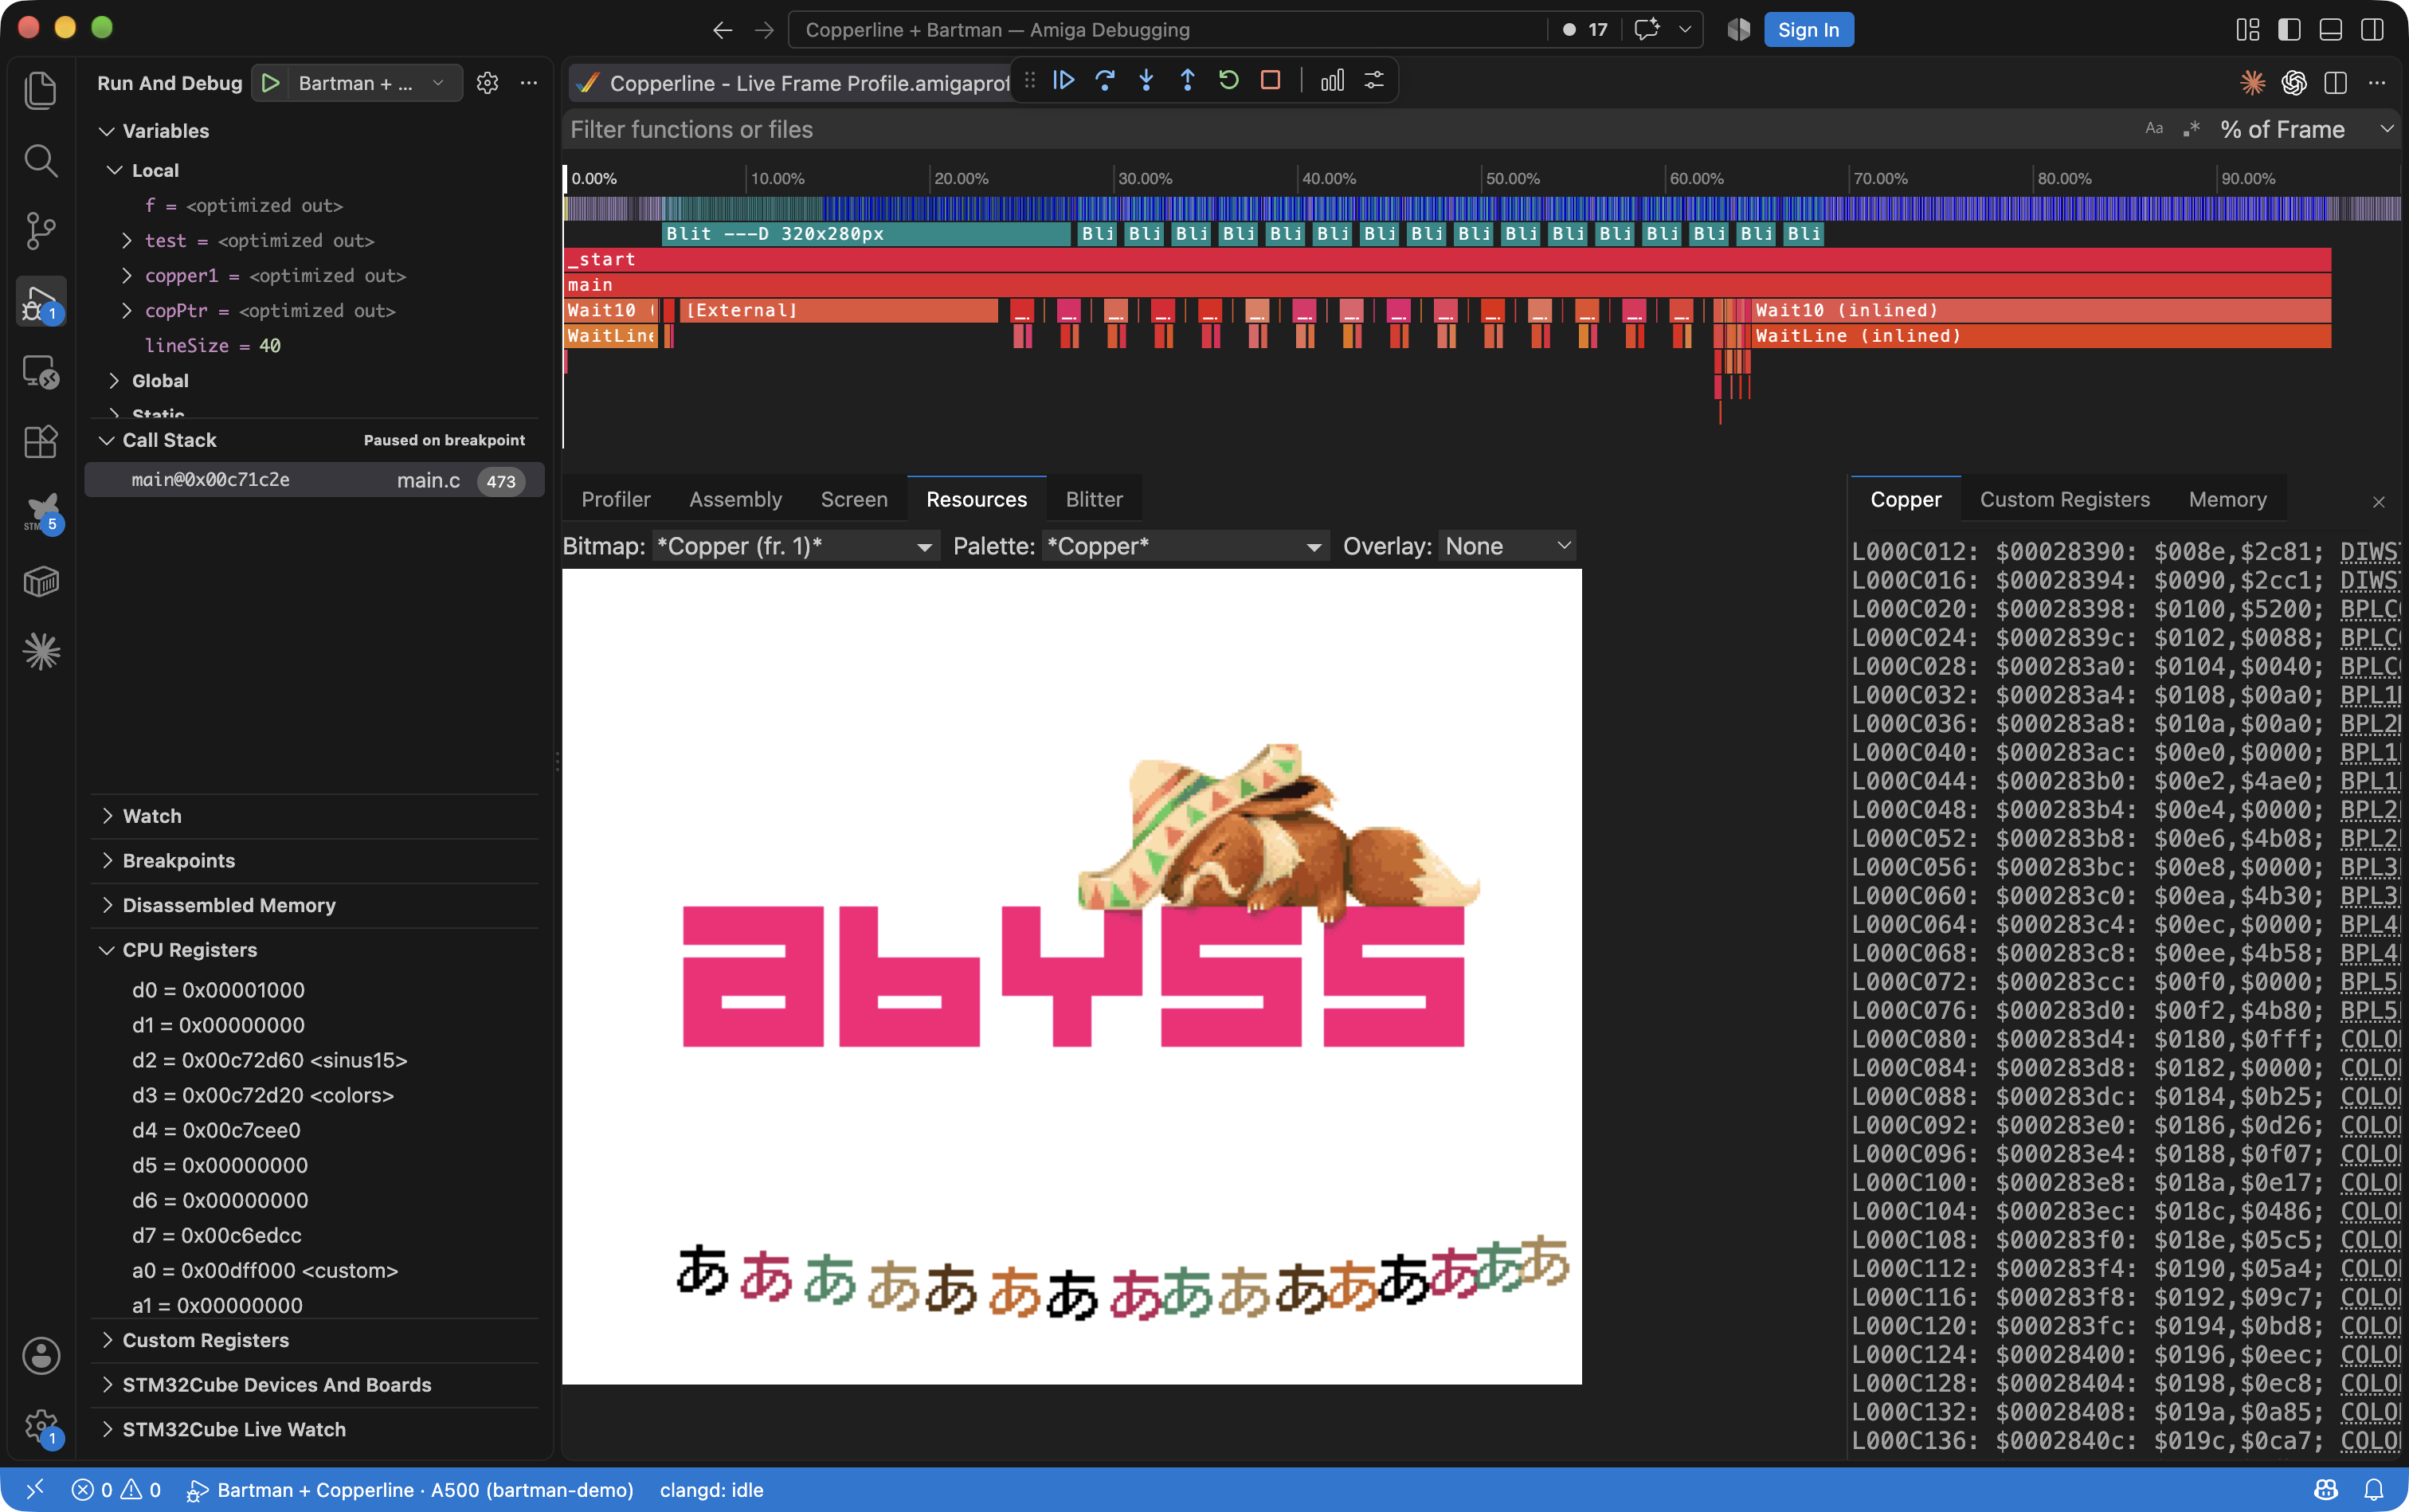
The inferred 320 by 256 bitmap and its Copper list in a captured frame. This is a reconstructed graphics resource, not a screenshot of the emulator window. The timeline places its setup and blits beside the CPU work. Open full-resolution screenshot.
Inspect named resources and custom registers
In Resources, select the template’s registered image.bpl bitmap. Select
a later position in the frame (about 88% in this capture), then open
Custom Registers alongside it. Bitplane pointers and palette values can
be compared with the named resource at that point in the frame.
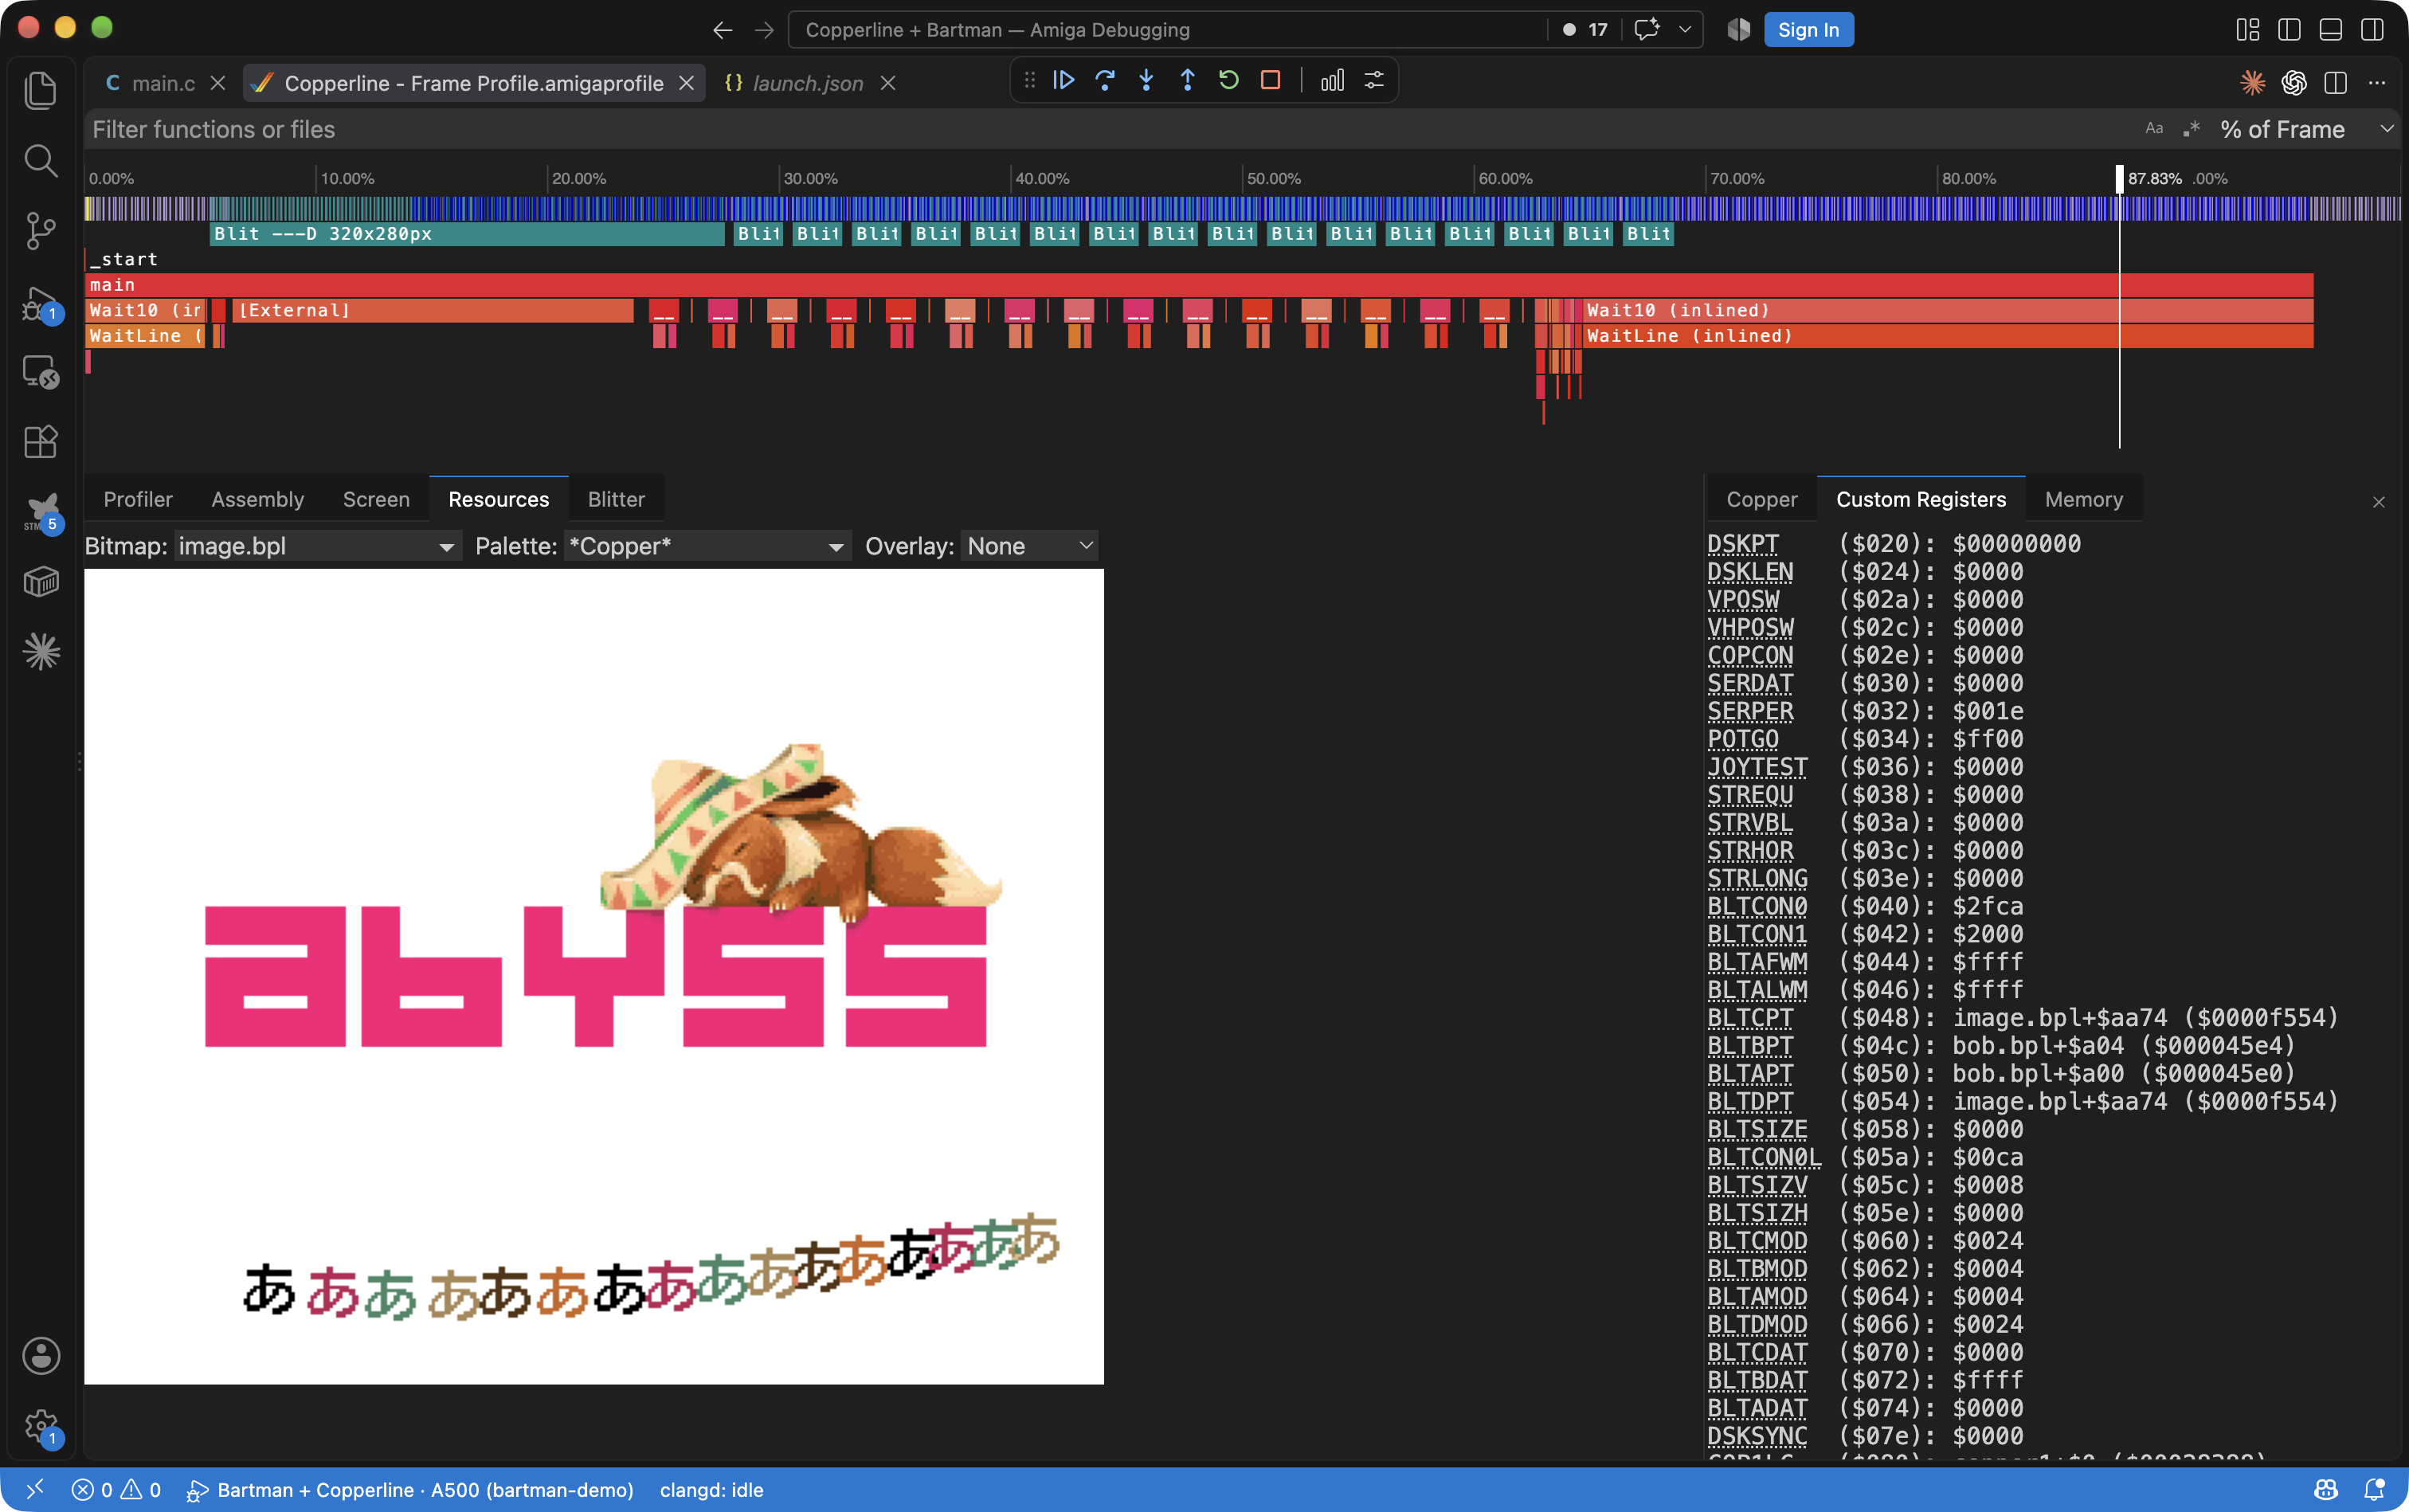
A named bitmap resource beside custom-register state. The template registers its resources with the debug helpers so pointers can resolve to useful names. Open full-resolution screenshot.
Follow a blitter operation
Select a Blit block in the timeline and open Blitter. Inspect the enabled A, B, and C input channels and the D destination to see how a bob is composed. Different blits have different enabled channels: the large screen clear uses D alone, while the bob operations combine source and destination data. Keep Copper open alongside it to relate the work to display setup.
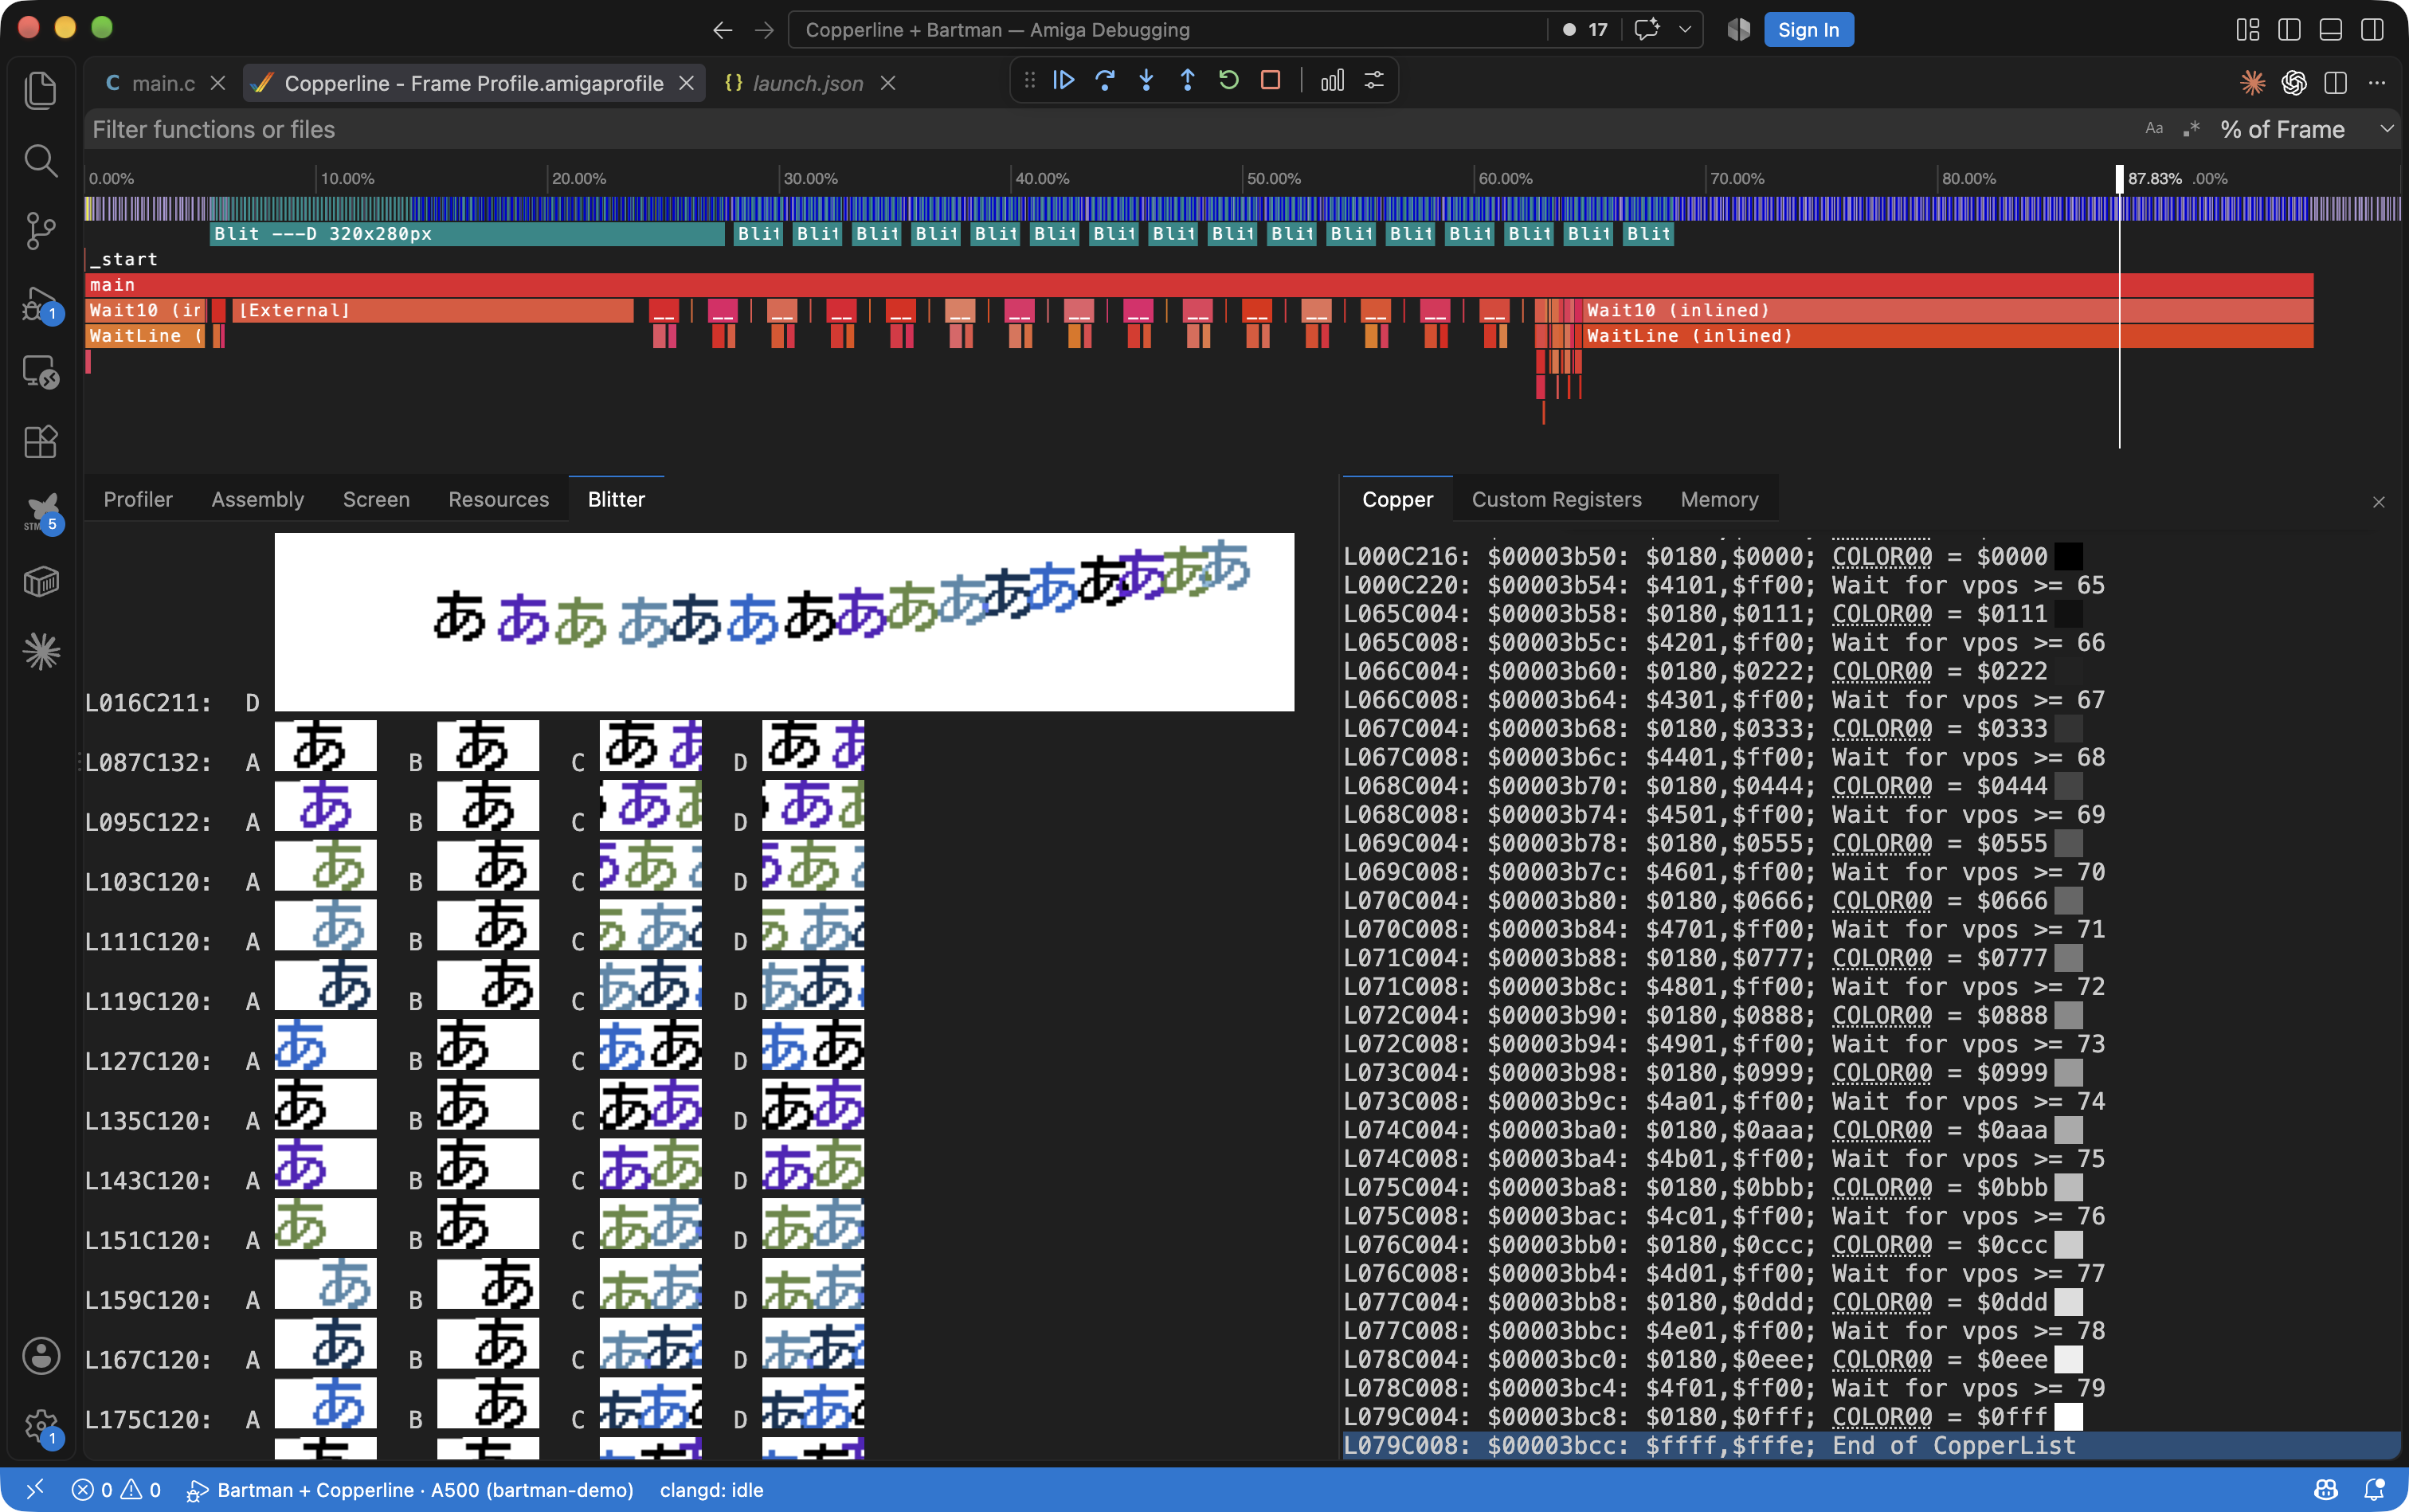
Channel previews explain what each blit reads and writes. Selecting another blit or timeline position changes the operation under inspection. Open full-resolution screenshot.
Find the expensive code and bus users
Open Profiler and expand the CPU tree through _start and main. Compare
self time with total time, including called functions. Expand the DMA tree
to see the contributions of bitplanes, blitter, Copper, and other bus users.
Follow a source link to connect a cost to the C code or assembly.
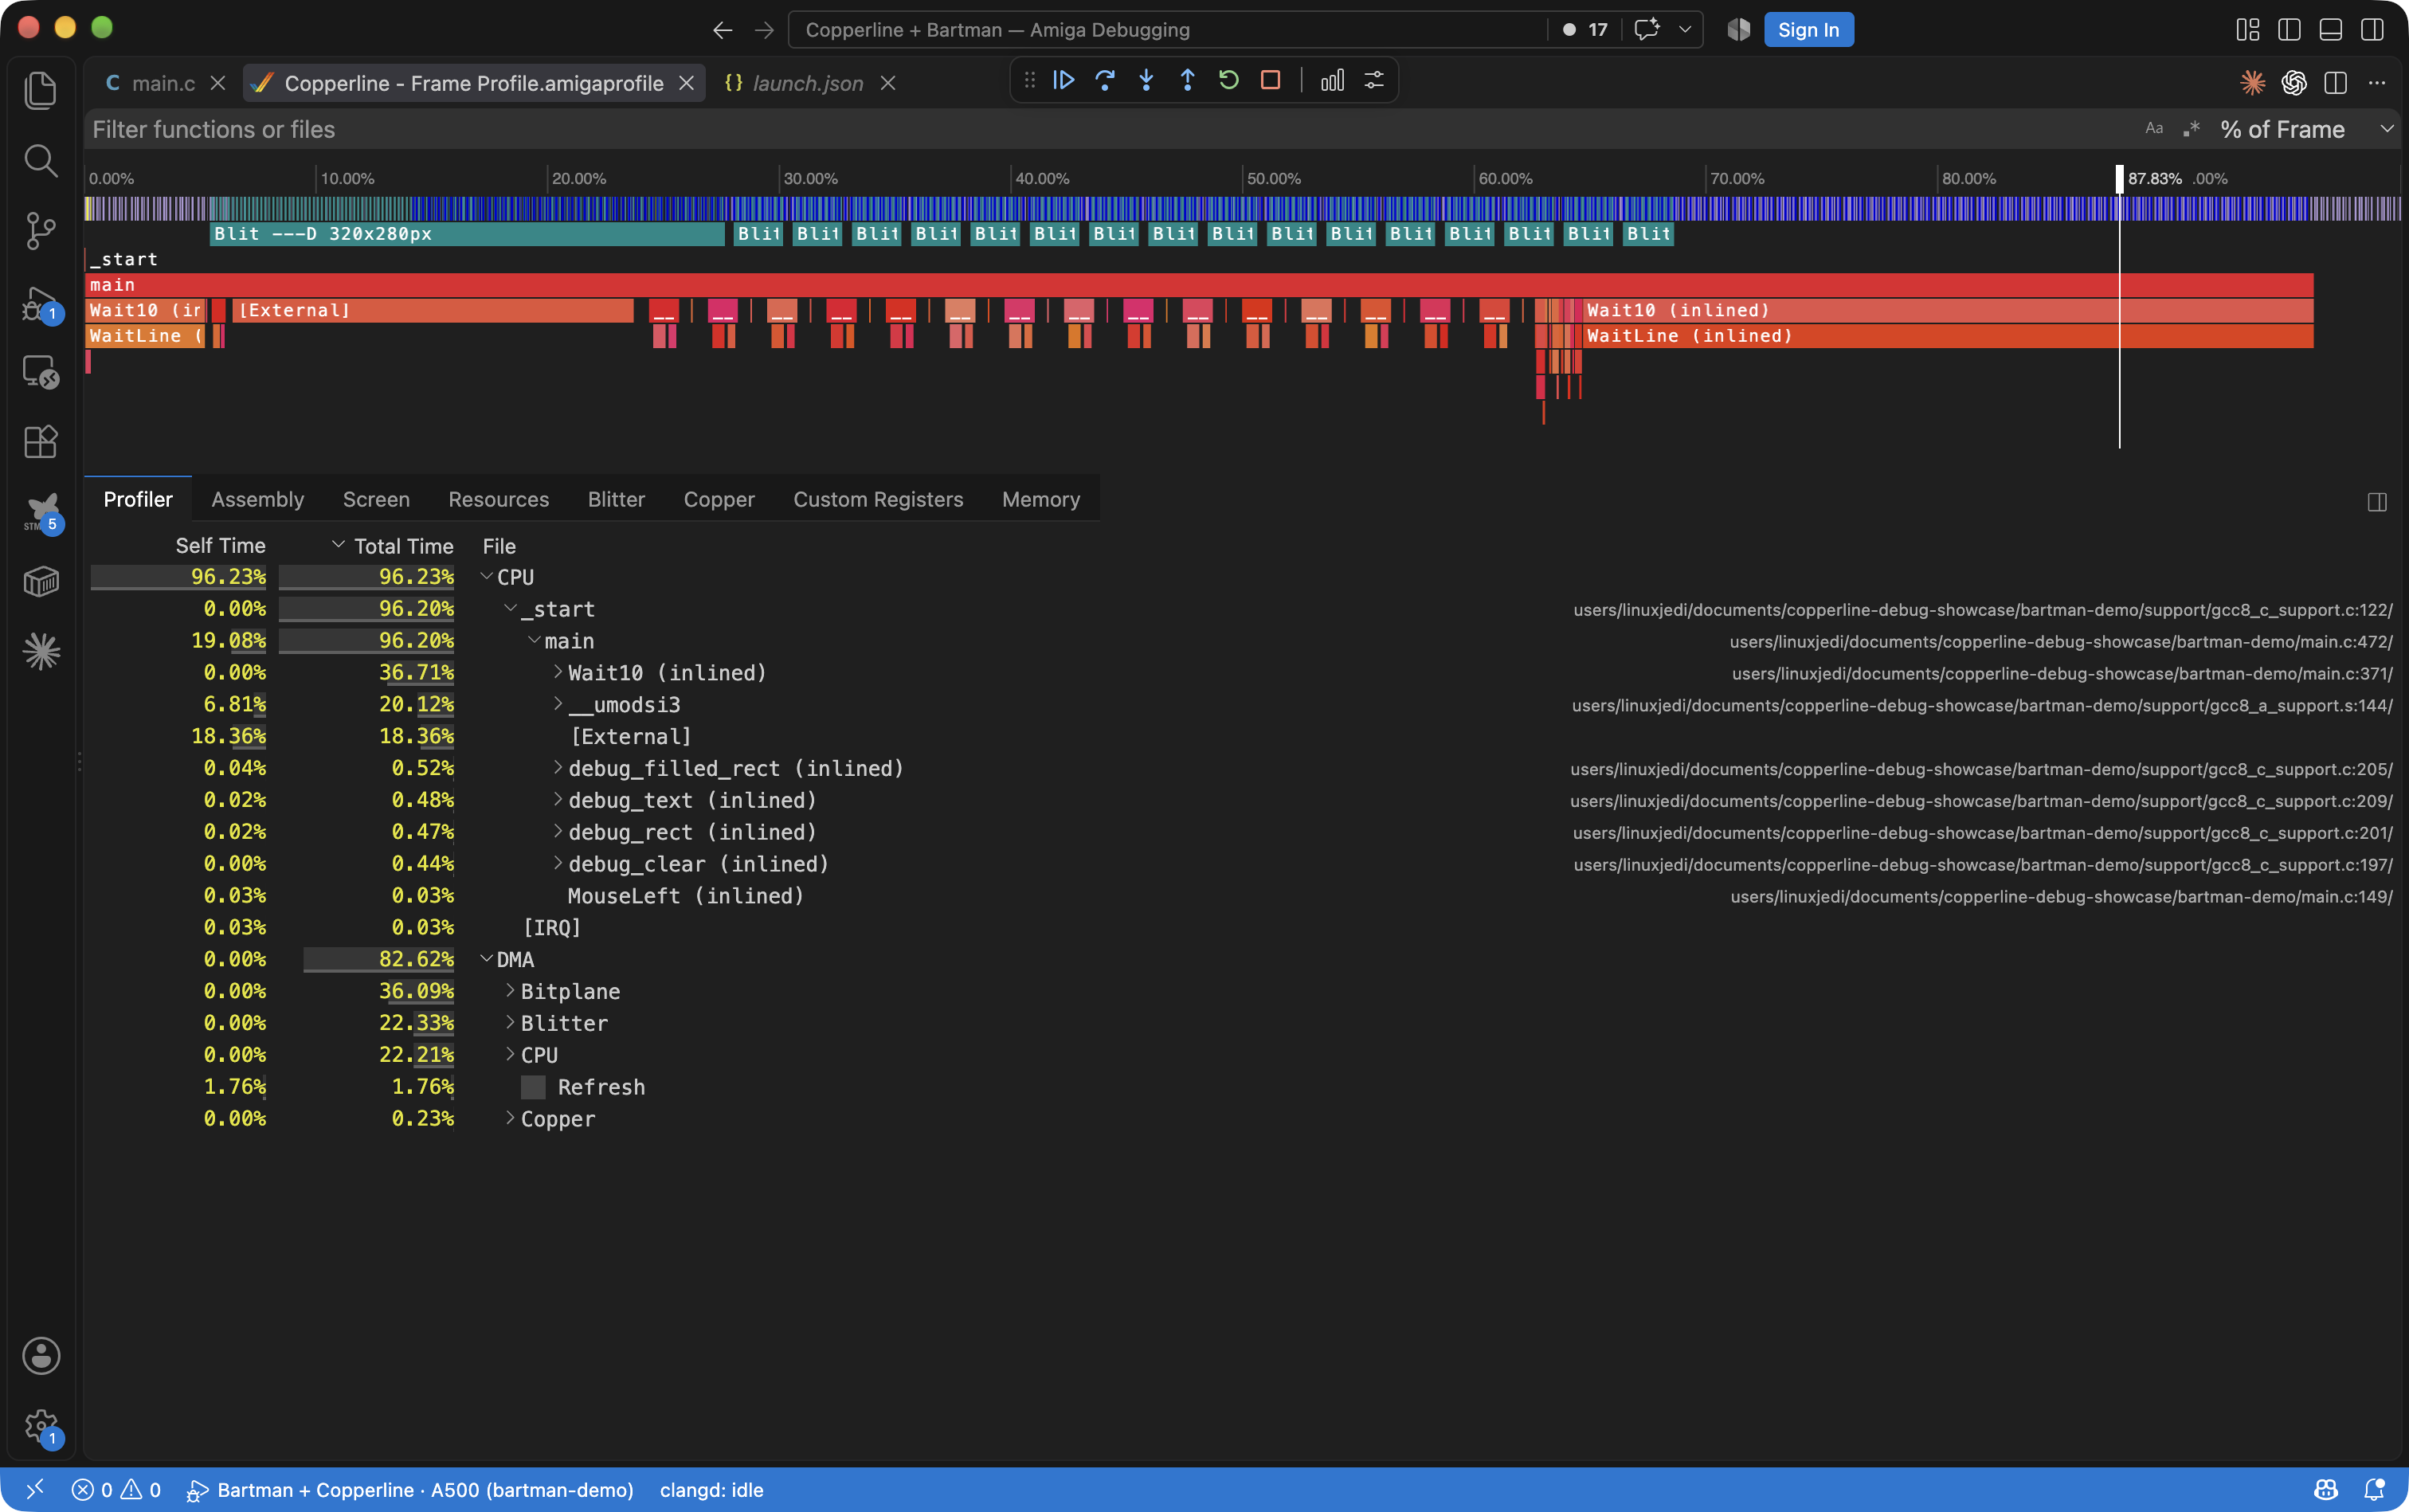
CPU costs and DMA activity from the same emulated frame. Their percentages describe overlapping activity; do not add the CPU and DMA totals together. These are guest frame costs, not a benchmark of the host computer. Open full-resolution screenshot.
Scope and troubleshooting
The Bartman capture format has a fixed PAL 227 by 313 DMA grid and contains chip and slow RAM. Use the A500 configuration above for this walkthrough. For NTSC, programmable display timing, or captures that need fast RAM, use Copperline’s native profiling tools. The Bartman GDB dialect exposes the 18 integer CPU registers; use the native adapter for fitted FPU registers. Its UAE save-state editor is a separate launch path; importing a UAE state into Copperline uses USS import.
| Symptom | Check |
|---|---|
| The backend setting is missing, or a UAE emulator starts | Install the pinned fork VSIX, reload VS Code, and set amiga.emulator to copperline in this workspace. Check that an update has not replaced the fork. |
| The compiler or GDB will not run | Check host architecture, Rosetta on Apple Silicon, and that the complete VSIX was installed. The fork repairs executable permissions on its bundled tools during activation. |
| Compilation uses another Amiga compiler on PATH | In the template task’s options.env.PATH, place ${command:amiga.bin-path}/opt/bin and ${command:amiga.bin-path} before ${env:PATH}; use backslash paths and semicolon separators in its Windows override. Clean and rebuild. |
| Launch fails to find the program or symbols | Use the suffix-free base name in program, and check that matching .elf and .exe files exist. |
| The guest boots but never reaches the first breakpoint | Use a current Copperline build, keep detached launch disabled on Kickstart 1.3, and rebuild matching executable/symbol files. Inspect the Debug Console for launch errors. |
| Bitmap choices are empty or the capture is uninteresting | Continue to the initialized frame loop before profiling. Select a populated point in the frame, and choose a bitmap and palette in Resources. Named entries require guest resource registration. |
For the wire protocol, manual GDB launch, and automated compatibility checks, see Bartman extension backend.