Copperline supports two VS Code integrations. Both launch a real emulator window and debug the Amiga program’s source. Choose the extension for the workflow you want:
| Integration | Use it for | Launch type |
|---|---|---|
| Copperline Amiga Debug | Source and instruction stepping, Step Back, variables, memory, chipset registers, native debugger windows, and .cpuprofile captures. | copperline |
| Bartman’s Amiga C/C++ extension, Copperline fork | Its bundled compiler and patched GDB, source annotations, and the visual CPU/DMA, Copper, bitmap, and blitter profiler. | amiga |
This chapter sets up Copperline’s native extension. For the illustrated graphics workflow and a reproducible installation of the separate Bartman fork, follow Bartman with Copperline. That installation does not depend on the upstream pull request being merged.
You can install both extensions. Select the appropriate launch configuration in Run and Debug, and stop one session before starting the other.
Build Copperline
The debugging features in these chapters ship in Copperline 0.19.0 and
later. The setup was checked against Copperline commit
3d334a11,
which includes the Bartman debugger startup fixes. An older installed
release does not contain them: install 0.19.0 or newer, or build from
source as below.
Install the platform prerequisites in Getting started, then build both programs from a current Copperline checkout:
git clone https://github.com/CopperlineHQ/Copperline.git
cd Copperline
cargo build --release --locked --bin copperline --bin copperline-ctl
Keep the checkout in place and point VS Code at the executables in
target/release. On Windows they have an .exe suffix. Use a release build;
debug builds are too slow for this workflow.
A release package works instead of a source build once it carries the
features you need: every package ships copperline-ctl next to the
emulator (Homebrew on PATH, the macOS bundle’s Contents/MacOS, the Windows
zip folder, the AppImage’s companion tools tarball, or the Flatpak’s
/app/bin); Command-line tools
lists the paths to put in the settings below.
The examples boot the bundled open-source AROS ROM, so no Kickstart download
is needed. If you move the executables out of the checkout, copy
assets/aros/ alongside them, preserving the directory name aros and its
licence files. The resulting layout includes:
copperline
copperline-ctl
aros/
  aros-amiga-m68k-rom.bin
  aros-amiga-m68k-ext.bin
If using your own ROM, normal direct executable launching supports Kickstart
1.3 and newer, including the A500 KS1.3 preset. Keep detach disabled on
1.3; detached launches require Kickstart 2.0+ or AROS. See
Direct executable launching.
Install Copperline Amiga Debug
With Node.js and npm installed, package the extension from the same checkout:
cd tools/vscode-copperline
npx --yes @vscode/vsce package --no-dependencies --out copperline-debug.vsix
code --install-extension ./copperline-debug.vsix --force
There is no separate JavaScript compilation step. If code is not on PATH,
run Extensions: Install from VSIX... in VS Code’s command palette and
select the generated file. Reload the VS Code window after replacing an
already loaded extension.
Open your Amiga project’s folder. Add these workspace settings to
.vscode/settings.json, replacing the example paths with absolute paths to
your build. Each setting names an executable file, not its directory:
{
  "copperline.ctlExecutable": "/absolute/path/to/Copperline/target/release/copperline-ctl",
  "copperline.emulatorExecutable": "/absolute/path/to/Copperline/target/release/copperline"
}
On Windows, JSON paths can use forward slashes, for example
C:/src/Copperline/target/release/copperline.exe.
Build and launch an Amiga program
Use your existing vasm, amiga-gcc, or ELF/elf2hunk project. For a new project,
run Copperline: Init Amiga Project, choose a destination and toolchain,
then open that folder. The generated Copperline: Build task builds
demo; the Bartman toolchain option also produces demo.elf. Its compiler
can be detected through the installed Bartman extension. Other toolchains
can be selected independently.
For that generated project, use the following .vscode/launch.json. It
selects a predictable A500 with AROS, regardless of saved launcher defaults:
{
  "version": "0.2.0",
  "configurations": [
    {
      "type": "copperline",
      "request": "launch",
      "name": "Copperline: A500 source debugging",
      "program": "${workspaceFolder}/demo",
      "preLaunchTask": "Copperline: Build",
      "factory": true,
      "model": "A500",
      "chip": "1M",
      "slow": "512K",
      "entryPoint": "main",
      "stopOnEntry": true,
      "noAudio": true
    }
  ]
}
For an existing project, change program to the actual Amiga hunk executable
and preLaunchTask to its build task, or omit the task if you build separately.
For an ELF/elf2hunk build, keep the matching ELF beside the executable or set
symbolFile explicitly. For example, Bartman’s template uses
"program": "${workspaceFolder}/out/a.exe" and
"symbolFile": "${workspaceFolder}/out/a.elf" with preLaunchTask set to
compile. The native adapter’s program includes the executable suffix;
Bartman’s own launch configuration uses the base name instead.
Build with debug information (-g or vasm’s -linedebug). Use -O0 when
examining C variables: optimization can remove locals or reorder source
statements. Keep optimized builds for measuring the code you intend to ship.
The debug information reference lists supported
formats and toolchain limitations, including newer amiga-gcc linkers that
discard DWARF when writing hunk files.
Stop, inspect, and step back
Select Copperline: A500 source debugging in Run and Debug, then press F5. The emulator boots, loads the program, and stops at
main.Click the source gutter to set a breakpoint on an executable statement. Continue to it, then use Step Over, Step Into, or Step Out.
Expand the variables and call stack. Select a caller to inspect that frame’s source and variables. Open Disassembly from the editor’s debug context menu to compare source with the actual 68k instructions.
Use Step Back to inspect the preceding execution state. Memory and registers follow the restored machine state; see Reverse debugging.
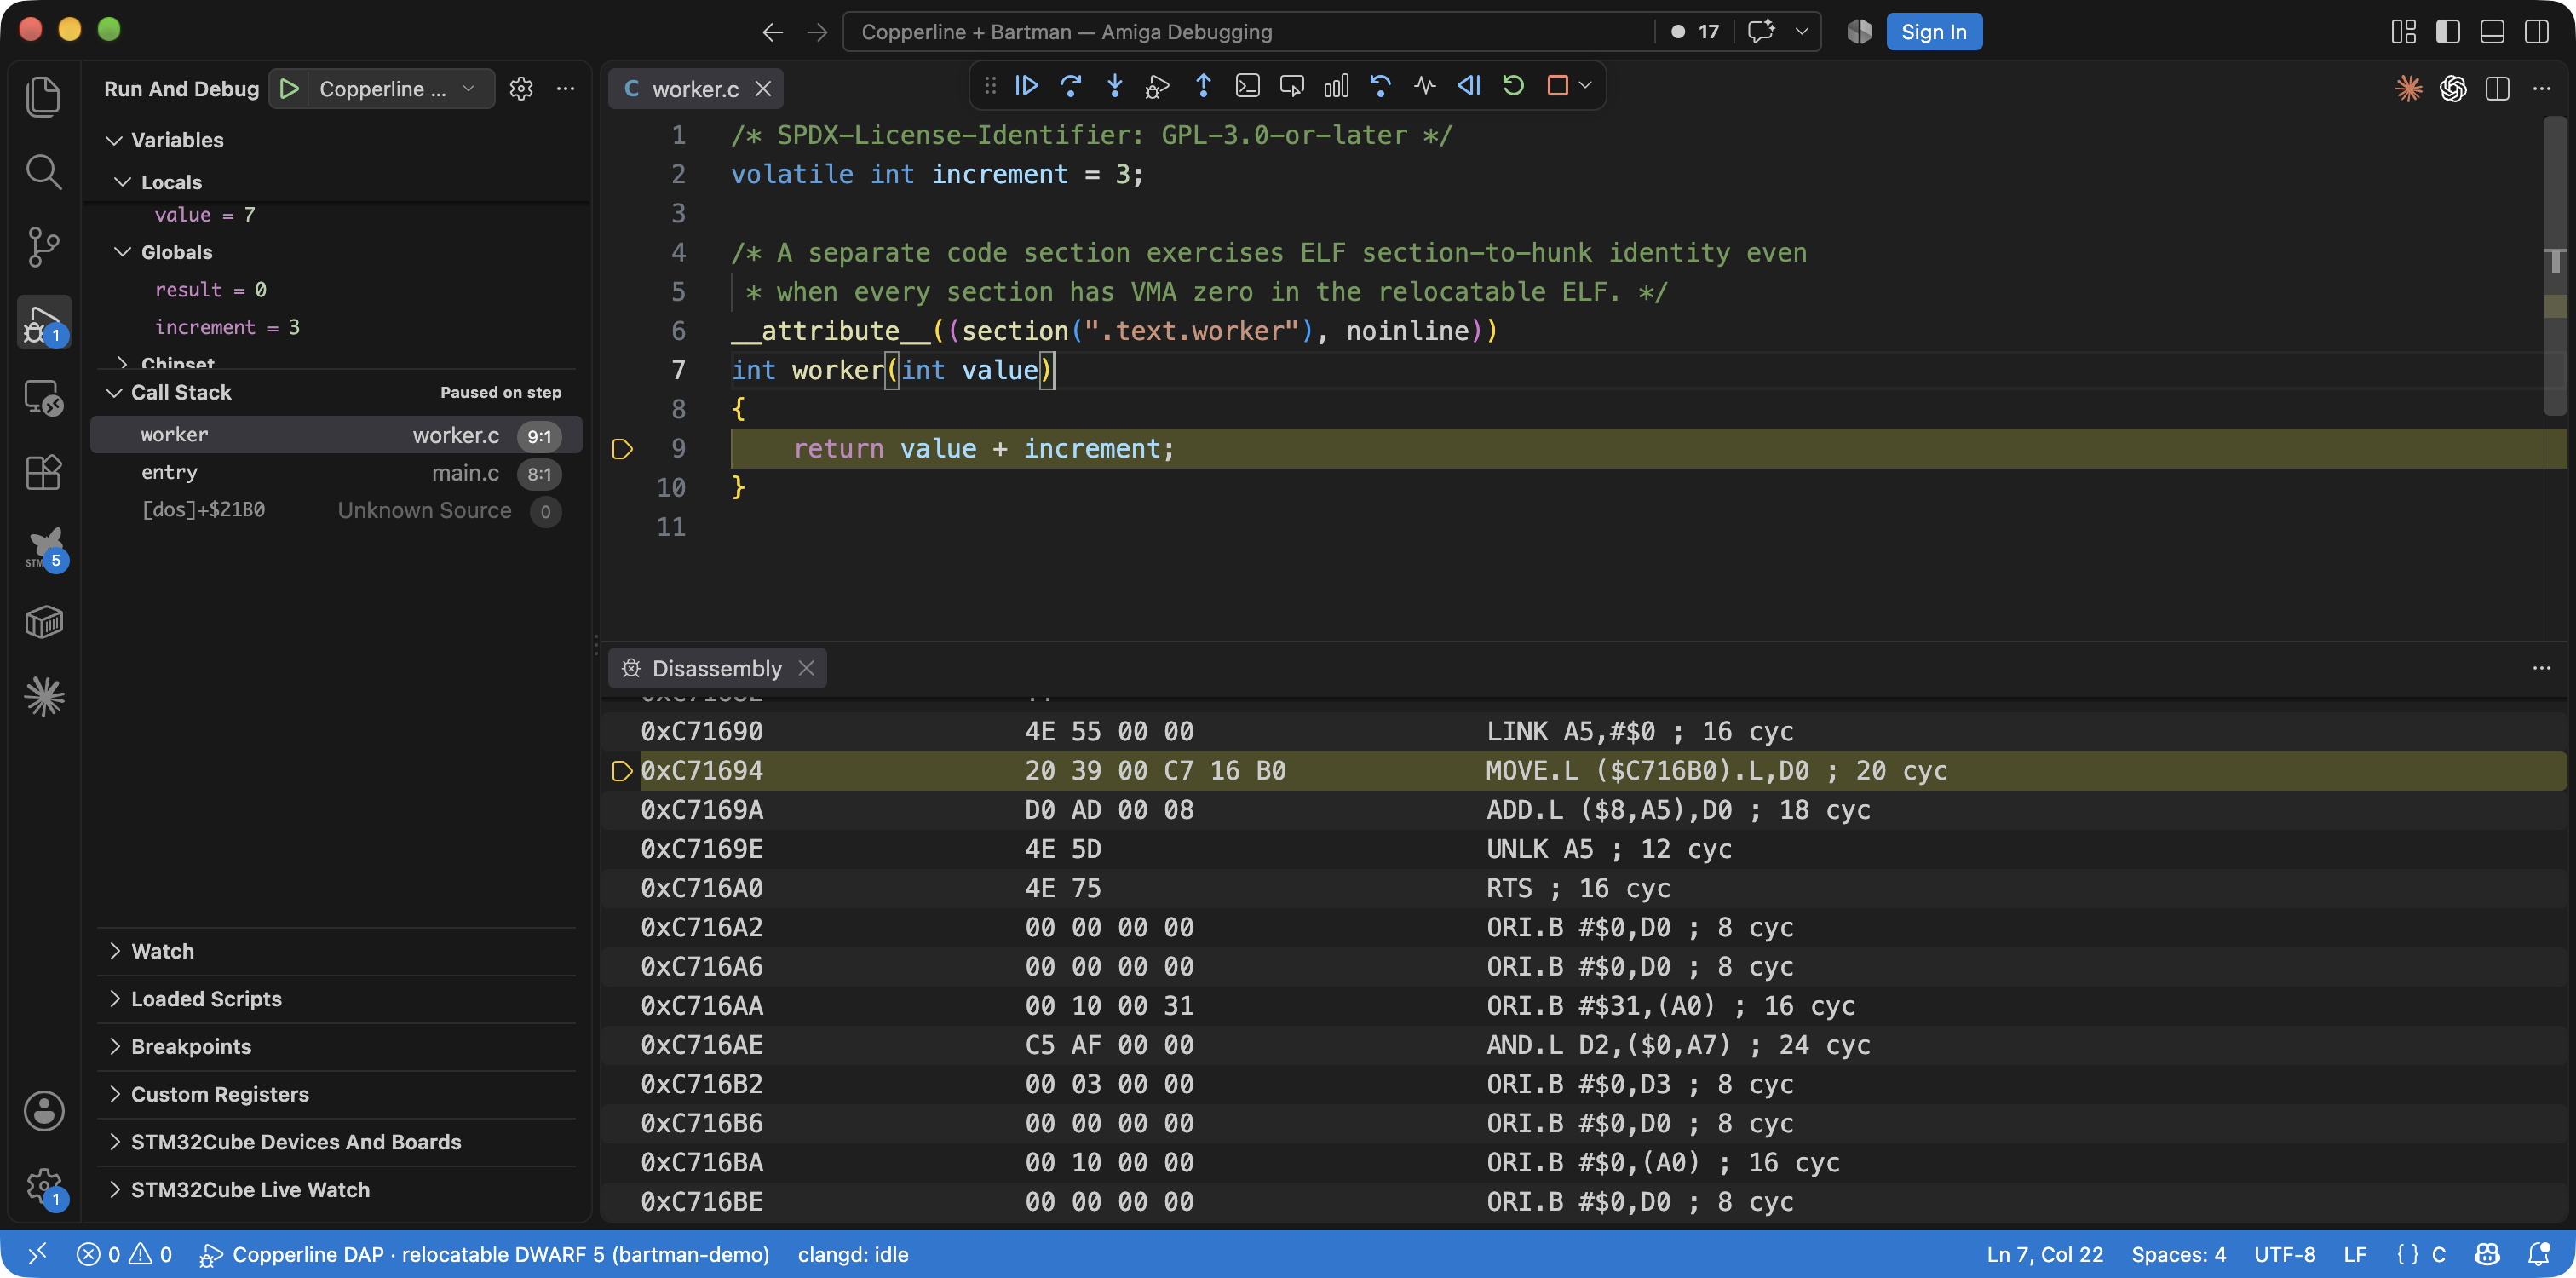
Native DAP debugging of a two-file ELF/elf2hunk program after an instruction step back. The worker’s parameter is 7 and the global increment is 3; source, variables, call stack, and disassembly describe the same stop. Open full-resolution screenshot.
This screenshot uses a small unoptimized test program, so its function names and values differ from the generated graphics demo. It demonstrates the multi-file DWARF relocation support, including relocatable ELF builds.
Expand Custom Registers for chipset state and hover a register for its access rules and bit fields. The debug toolbar also opens Copperline’s native Debugger, Console, and Frame Analyzer windows.
Capture a CPU profile
While paused in the loaded program, click Profile in the debug toolbar
for one emulated frame, or Profile (Multi) to choose a frame count.
Copperline opens a source-mapped .cpuprofile in VS Code. A [Bus wait]
child separates chip-DMA contention from CPU work in a function.
For bitmap previews, blitter channels, and the combined CPU/DMA timeline, use the separate Bartman profiling walkthrough. See Instruction profiling for capture formats and automation, and the DAP reference for all launch and attach options.
View guest coverage
Add coverage to the launch configuration to have the emulator collect
line and function coverage of the program from its first instruction to its
exit, written as an lcov .info file (the emulator’s
--coverage run):
{
  "type": "copperline",
  "request": "launch",
  "name": "Copperline: coverage",
  "program": "${workspaceFolder}/demo",
  "coverage": "${workspaceFolder}/lcov.info",
  "sourceMap": { "/build/src": "${workspaceFolder}" },
  "stopOnEntry": false,
  "noAudio": true
}
The file is written when the program exits or when the session is stopped,
with sourceMap applied to its paths. Two ways to see it:
Coverage Gutters (
ryanluker.vscode-coverage-gutters) watcheslcov.infoin the workspace by default (coverage-gutters.coverageFileNamesadds other names); Coverage Gutters: Display Coverage paints the gutters and Watch keeps them current across runs.VS Code’s built-in coverage view: run Copperline: Show Coverage from the command palette (or Run Tests with Coverage on the Copperline Coverage item in the Test Explorer). The command asks for the
.infofile, then VS Code’s Test Coverage panel lists each source file with its line and function percentages and the editor shows per-line hit counts and uncovered lines.
For a static report, genhtml lcov.info -o coverage-html from the lcov
package renders the same file. The file’s leading # lines account for
instructions the program retired outside any known source line, such as an
assembly startup stub, and for the Kickstart’s own instructions.
Troubleshooting
| Symptom | Check |
|---|---|
| VS Code cannot start the adapter or emulator | Both executable paths, file permissions, and the Windows .exe suffix. Rebuild both binaries from the same Copperline checkout. |
| AROS ROM cannot be found | Keep the source checkout’s assets/aros directory, or copy it to aros beside a relocated executable. |
| Breakpoints stay unbound or source is missing | The loaded hunk and ELF must come from the same build. Keep -g; set symbolFile for a differently named ELF. Use sourceMap for sources moved since compilation. |
| Locals are optimized out | Rebuild with -O0, then stop and relaunch. A profile of an optimized build can still have useful source attribution. |
| The machine differs from the example | Keep factory: true, or deliberately select an explicit Copperline config. |
| Bartman settings seem to have no effect | This adapter uses type: copperline and copperline.* settings. The separate Bartman adapter uses type: amiga and amiga.* settings. |